- Concept
- Version · 6.0
- Monitor
The rolling 24-hour view
Last updated: September 29, 2026
The Liquibase Secure rolling 24-hour view shows your database change activity from the last day. Lists, metrics and trends cover the last 24 hours, and everything older is still recorded.
What the rolling 24-hour view is
The rolling 24-hour view sets the earliest point in time that operations, metrics and trends draw from. The console calls that boundary the window.
The 24 hours are measured back from the moment each page loads. The window is not a calendar day and does not reset at midnight. With Change Intelligence, you can choose any date range, up to and including everything the workspace has recorded.
Without Change Intelligence, the console also locks the pages and cards that need it. Everything else is a complete console reading a shorter span of time.
What the window does not change
The window limits what the console shows. It does not limit what is recorded or kept.
Recording is unaffected. Liquibase records every operation in full, whatever the window.
Your history is kept. Operations older than the window are still recorded. They are not discarded, deleted or downsampled, and they become visible when the window extends.
Detail is unaffected. An operation's detail page shows its messages, changeset outcomes and execution logs in full. The window limits how far back, never how deep.
Filters are unaffected. Search, filters, sorting, saved views, pagination and the copy-link action all work within the window.
What the window changes on screen
The window ribbon
On the Dashboard and All Operations, a single line under the page header states that you are seeing a rolling 24-hour view of database change activity. It is never a modal and never blocks the page.

No other page carries the ribbon. A locked page carries its own explanation instead.
The ribbon cannot be dismissed, because it is the one place that states why the console is limited. The range pills on each card and the end-of-window marker stay too, because they state what range a number covers.
The time-range control
The time-range control reads Last 24 hours, with a caption stating the rolling 24-hour view. The full preset list (7, 30 and 90 days, custom and all-time) is available with Change Intelligence.

If you arrive with a wider range, from a bookmark, a shared link or a saved view, the console shows the last 24 hours and a notice above the results says so. The notice names the range that was applied and how far back the range you asked for reaches, and states that earlier activity is still recorded. The page does not error, and it never presents 24 hours of data as though it covered the range you asked for.

A saved view with a wider range still opens. Its other criteria apply as saved, and only its range changes.
Metrics and tiles
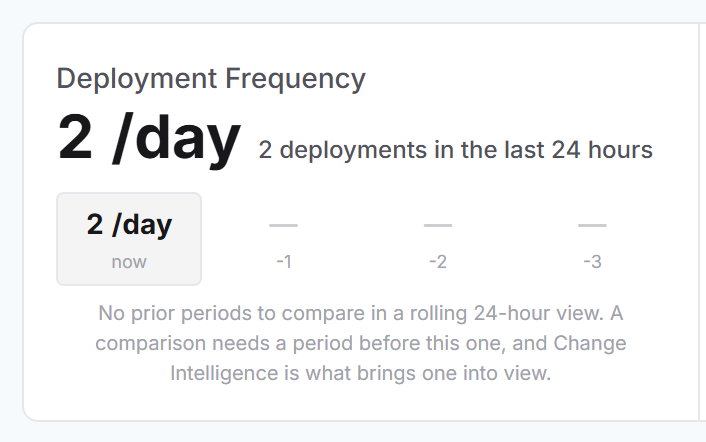
All fifteen dashboard tiles render with real values. Each tile states the range it covers on its own face.
What changes is what a number can be compared against. A 24-hour view has no prior period, so a week-over-week trend cannot be calculated. In place of the trend, the tile states the figure for the window, for example 11 deployments in the last 24 hours. Direction indicators are neutral, because there is nothing to compare against.
The end-of-window marker
Where a list stops at the window, a marker at the end of the list names the boundary and counts the operations recorded before it:
End of the 24-hour window. 1,070 earlier operations are already recorded and become visible when the window extends.
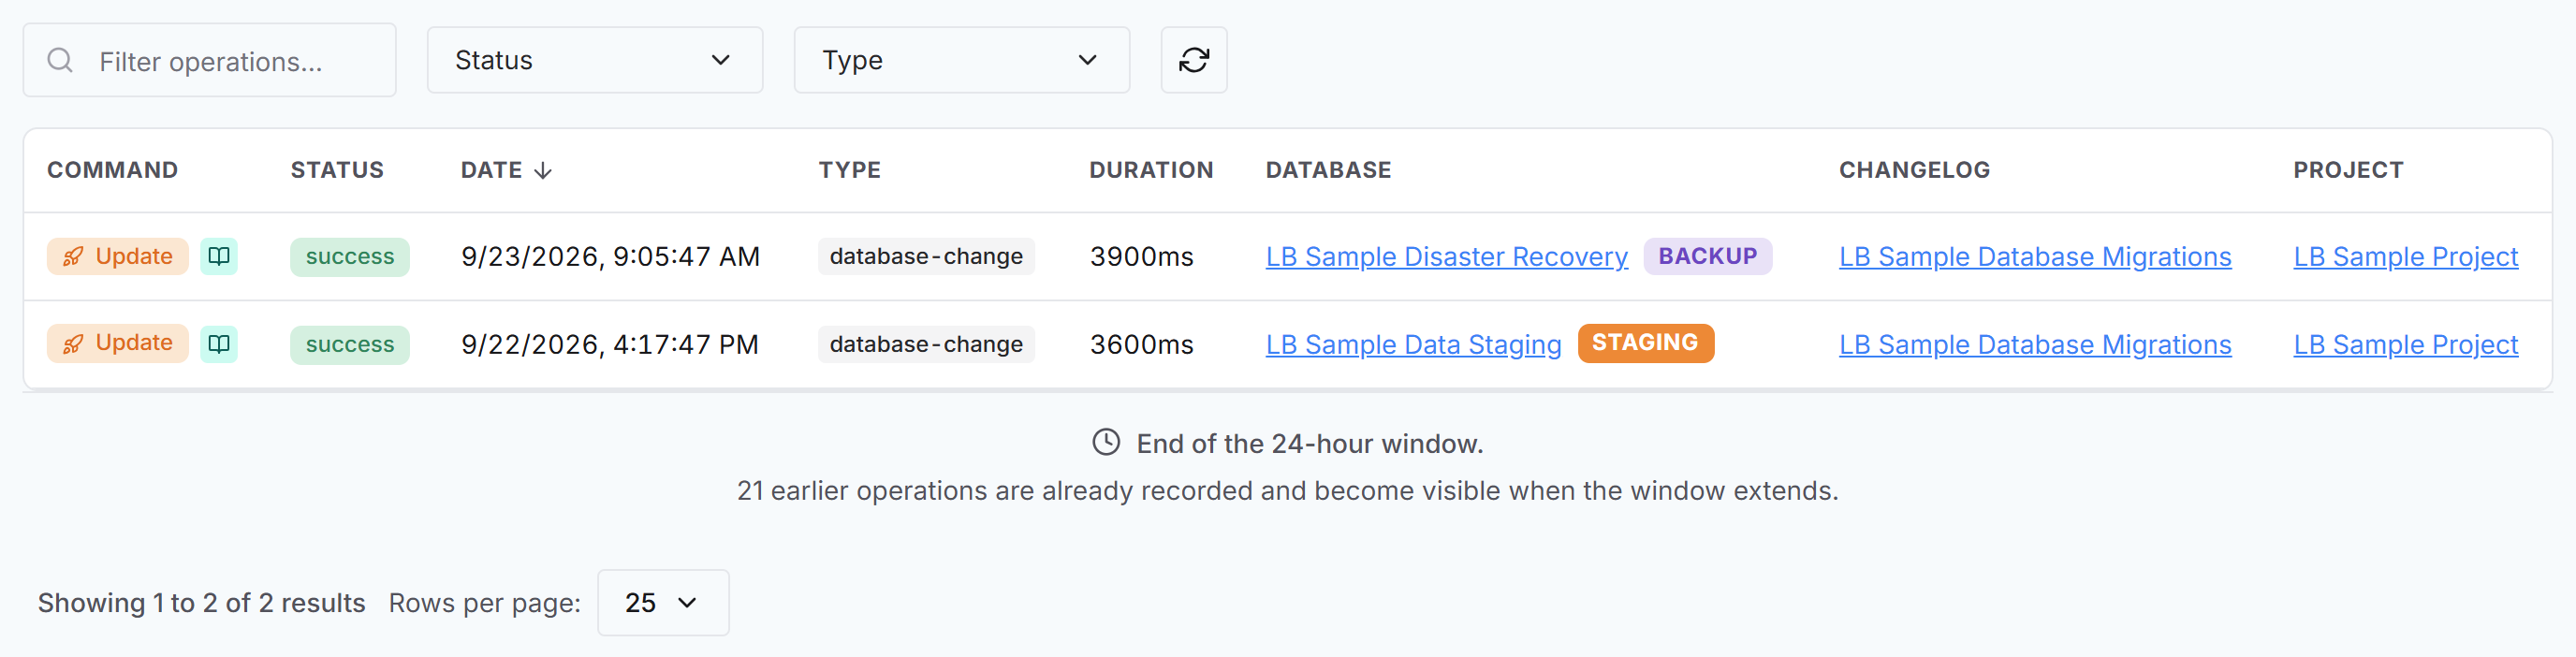
The count comes from your workspace’s own records. It is always a number of operations, never a length of time, and it counts records of the type the list is showing.
The marker appears on the last page of a list only. On page 1 of 10, the list stopped at the page, not at the window.
Pages and cards that need Change Intelligence
Without Change Intelligence, some pages and cards are locked rather than limited to 24 hours. A locked page or card keeps its place and its heading, and states that it is not included in your license. It never shows empty or placeholder data, and it does not mean that anything failed to load or was deleted.
The table lists each locked page and card, and what still works while it is locked.
Page or card | Where it appears | What still works |
|---|---|---|
Database Changes | The Monitor section of the navigation, with a lock icon | All Operations, which lists every operation from the last 24 hours |
Policy Checks | The Monitor section of the navigation, with a lock icon | Pass and fail counts on the Dashboard |
Drift Detection | The Monitor section of the navigation, with a lock icon | Drift counts on the Dashboard |
Deployment Matrix | A project's Deployment Matrix tab | The project's other tabs, and All Operations |
Policy Checks card | A database connection's page | The rest of the page, including the connection's operations history |
Drift Detection card | A database connection's page | The rest of the page, including the connection's operations history |
Policy Checks card | A changelog's page | The rest of the page, including the changelog's operations history |
AI Analysis | An operation's detail page | The operation's messages, changeset outcomes and execution logs |
A locked page offers two links, Learn about Change Intelligence and Back to Dashboard. The Deployment Matrix offers View All Operations in place of Back to Dashboard.
A locked page looks the same whether you open it from the navigation, a bookmark or a shared link.
Pages under Govern are never locked.
AI Analysis and the AI-Powered Analysis setting
Two different things decide whether AI Analysis appears on an operation, and they look different on purpose.
Without Change Intelligence, the AI Analysis panel always appears locked, with a chip reading
Not in your license. This holds whatever the AI-Powered Analysis setting says. You can turn that setting off, but you cannot turn it on.With Change Intelligence, the AI-Powered Analysis setting on the Features settings page decides. When it is on, the panel works. When it is off, the panel does not appear at all.
Telling an empty window from an empty workspace
Four messages can appear where you expect data, and they mean different things. The icon and the wording tell them apart.
What you see | What it means | How to recognize it |
|---|---|---|
| The operations exist and are older than the window | Clock icon at the end of a list. States how many earlier operations are recorded |
| The workspace has recorded activity, but none of it is in the last 24 hours | Clock icon in place of a list. States how many operations are already recorded |
| Nothing has been recorded for this workspace, or for this operation type | Tray icon. No mention of the window |
| Change Intelligence has ended on this installation | Clock icon. States that nothing was deleted and how many operations are still recorded |
The difference that matters most is between Nothing in the last 24 hours. and No operations recorded yet. Both show an empty page. The first states how many operations are already recorded, because you have databases connected and history recorded. The second states no count and no range, because there is nothing recorded yet. If you see a count of recorded operations, the operations exist and are older than the window.
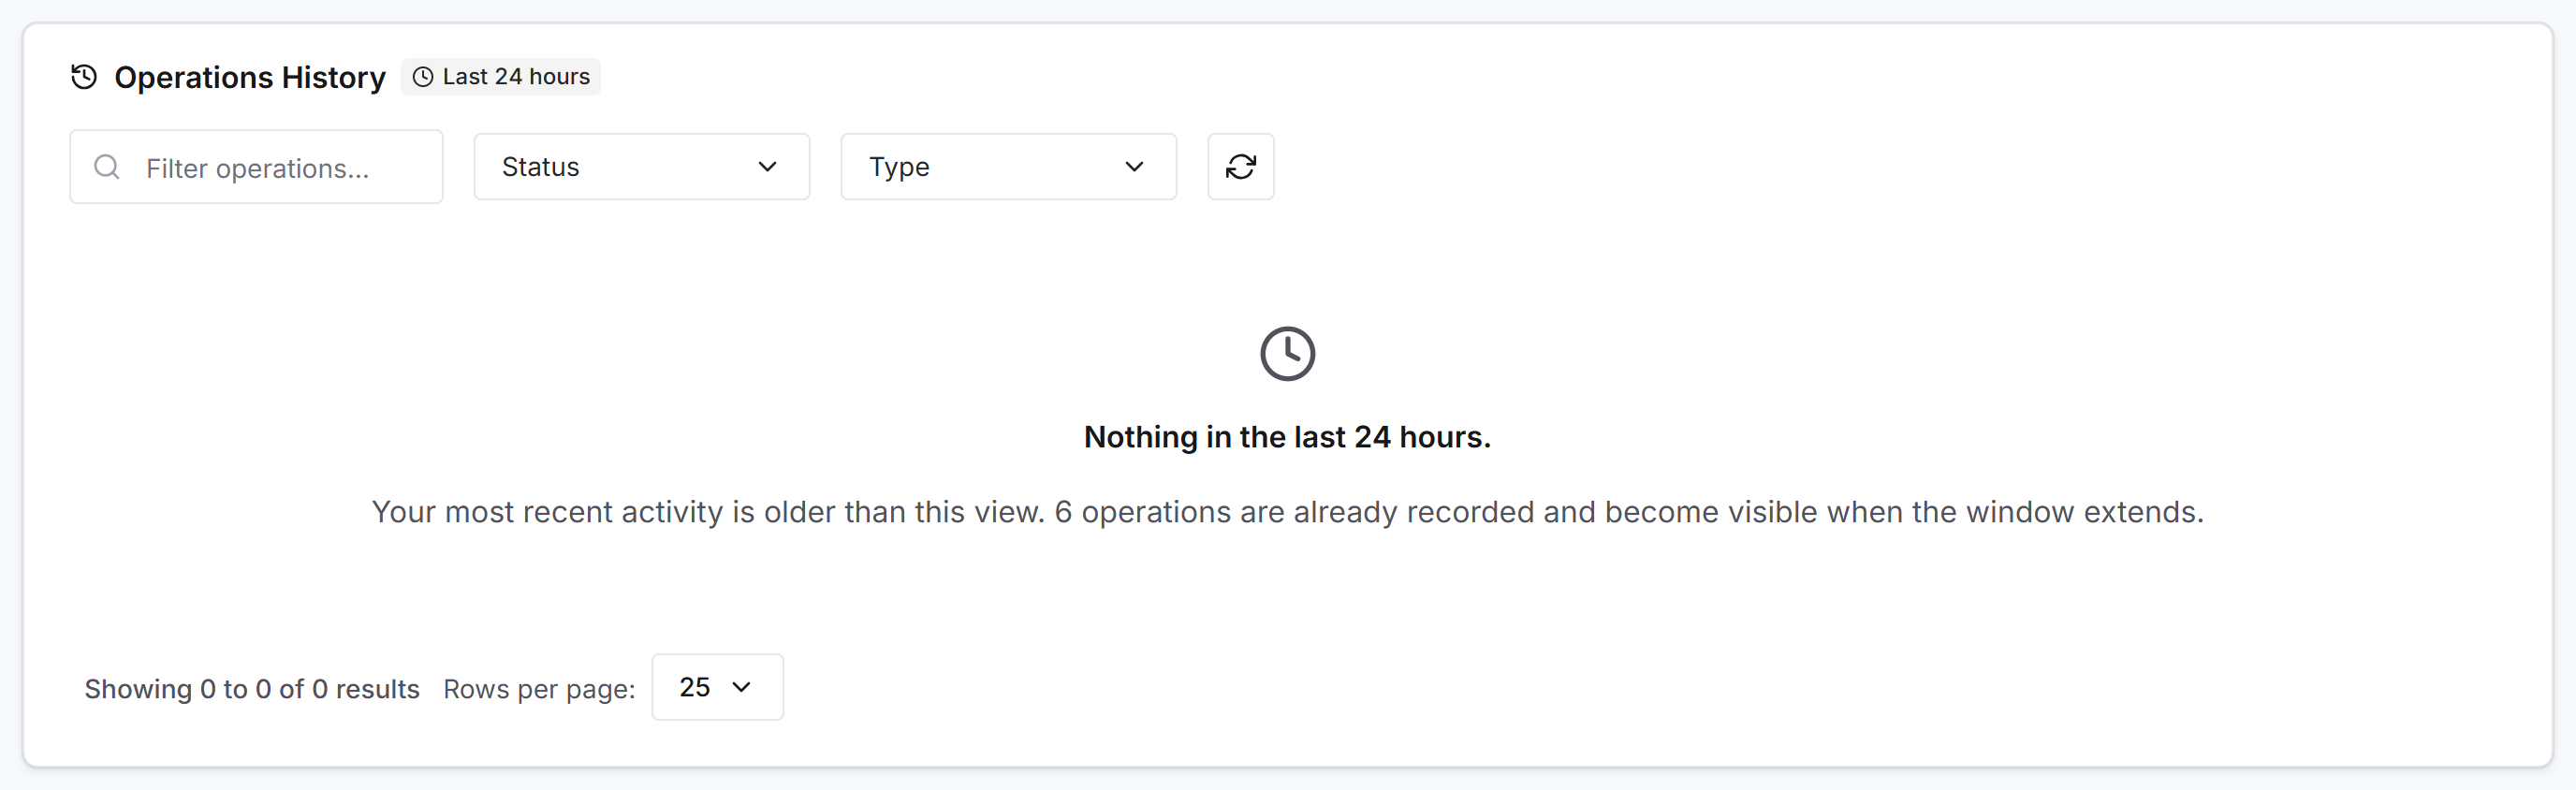

Nothing in the last 24 hours. is normal for any workspace that deploys less often than daily.
On the dashboard, a tile with nothing in the window reads No activity in the last 24 hours instead of a zero.

A search or filter that matched nothing takes priority over all of these. If a search or a status filter emptied the list, the page says that rather than pointing to the window.
Where to see which view is in force
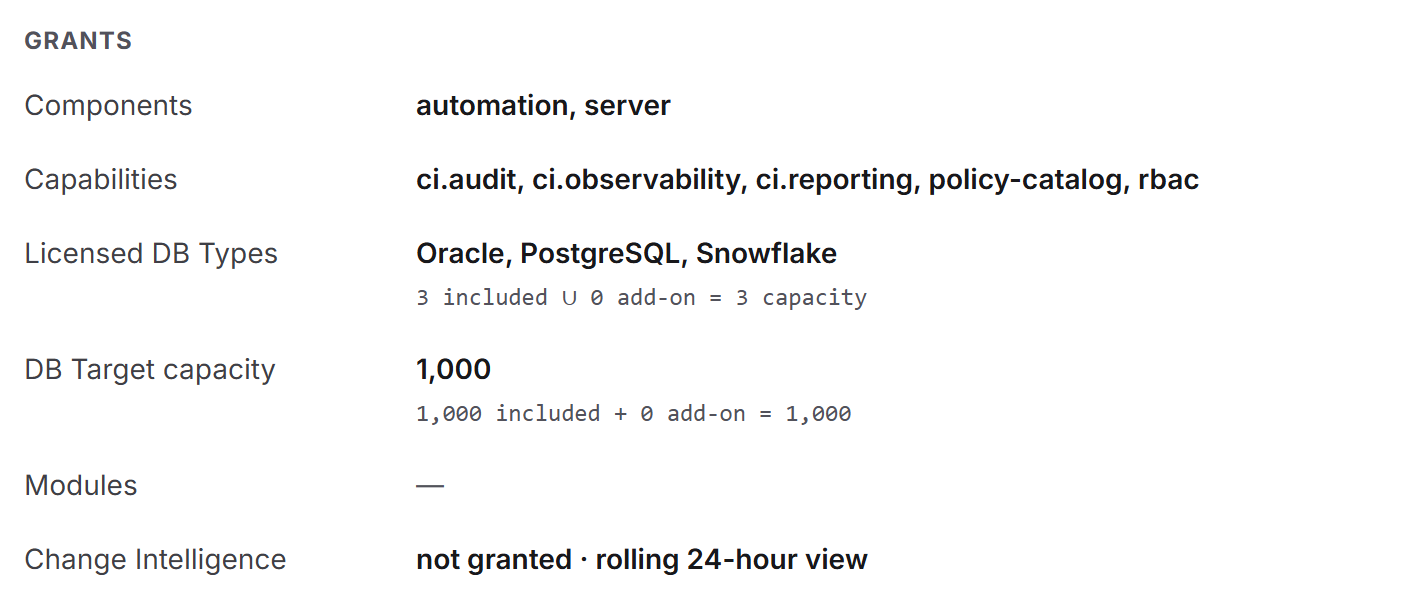
The License Management page shows a line beside the license details reading not granted · rolling 24-hour view or granted · any date range.
How the window is applied
An operation is inside or outside the window according to when it started, not when it was reported. An operation that started 30 hours ago and reports now is recorded and counted at the end-of-window marker, but it does not appear in a rolling 24-hour view, not even briefly. Reporting it again does not move it into the window.
If the console cannot determine whether Change Intelligence is part of your license, it shows the rolling 24-hour view rather than an error or an empty page. It also locks the pages and cards that need Change Intelligence.
Key terms
Term | Definition |
|---|---|
Rolling 24-hour view | The console’s view of database change activity from the last 24 hours, measured back from the moment each page loads |
Locked | A page or card that needs Change Intelligence. It keeps its place, states that it is not included in your license, and shows no data |
Window | The boundary of the view. Lists stop at it and metrics are calculated within it |
End-of-window marker | The line at the end of a list that names the window and counts the earlier operations already recorded |
Any date range | What the time-range control offers with Change Intelligence, up to everything the workspace has recorded |
Extending the window and unlocking pages
The window extends, and every locked page and card unlocks, when Change Intelligence is part of the license on your installation. Import the updated license file on the License Management page. The change takes effect straight away, without a restart. Removing the license file that grants Change Intelligence brings the window and the locks back.
Extending the window applies to your history too. Everything the workspace already recorded becomes visible at once, because it was never removed. Week-over-week trends appear on every metric, the comparison blocks fill in, and the time-range control offers its full preset list.
If Change Intelligence has ended on your installation, contact your Liquibase Customer Success representative.