- Task
- Version · 6.0
- Measure
Measure drift across your databases
Last updated: September 29, 2026
The Drift Detection dashboard reports how widespread schema drift is and whether it is spreading.
Before you begin
Contact us to enable Change Intelligence.
At least one
diffordiff-changelogrun has been reported to the server. Those are the operations these figures are computed from.
Procedure
Open the Drift Detection dashboard
Under Monitor, open Drift Detection. The window follows the time range you select and defaults to 30 days. The same five figures appear on the Operations Dashboard, always over the last 30 days.
Read the figures
The tiles sit at the top of the dashboard.
Drift Rate is the headline, but read it next to Database Coverage. A rate calculated over a small share of your databases is describing that share, not your estate.
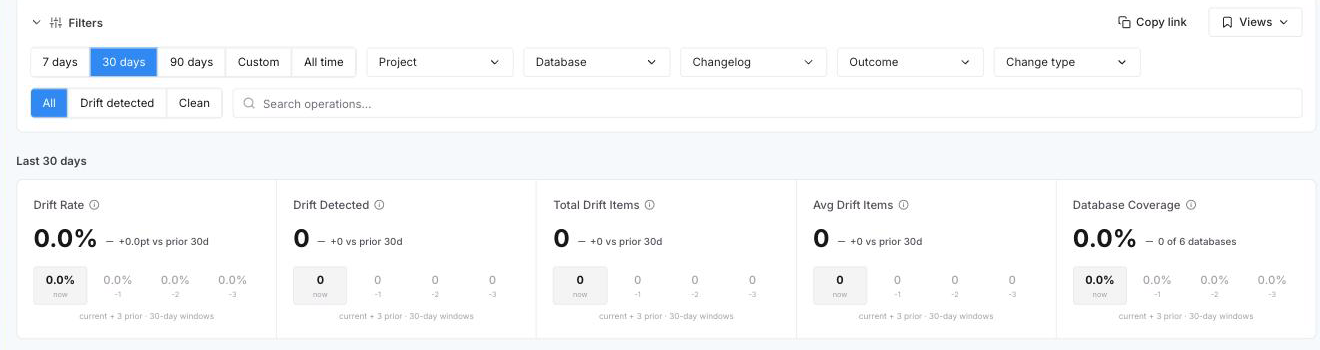
Metric | Description |
|---|---|
Drift Rate | The share of operations that detected drift, as a percentage. Only operations where the |
Drift Detected | The number of operations in the window that detected drift. This counts operations, not databases, so ten checks of one drifted database count as ten. |
Total Drift Items | The number of distinct drift items in the window, deduplicated per database. A drift item that keeps appearing across consecutive checks of the same database counts once, so a long-standing drift does not inflate the total every time you check for it. |
Avg Drift Items | Total Drift Items divided by the number of operations that detected drift. Because the total is deduplicated per database, this is an average of distinct items rather than of raw per-run counts. |
Database Coverage | The share of your registered databases that have had at least one drift check in the window, as a percentage. Archived databases are excluded. Use this to spot databases nothing is checking, as opposed to databases that are checked and clean. |
Note which figures count operations and which count objects
Drift Detected and Total Drift Items do not divide into each other. Drift Detected counts operations, so a database checked ten times while drifted contributes ten. Total Drift Items counts objects and deduplicates per database, so the same missing index found by ten consecutive checks contributes one. Avg Drift Items is the figure that relates them, and it answers how much drift a typical affected database is carrying.
Check which direction each should be moving
Drift Rate and Database Coverage read in opposite directions: a falling drift rate is good, and rising coverage is good.
Read them together. A drift rate that falls because you stopped checking is not an improvement, and coverage is what shows that. Database Coverage divides by every registered connection that is not archived, so archive the connections you no longer use rather than leaving them to hold the figure down.
If the metrics cannot be loaded, the tiles are replaced with an Unable to load drift metrics message rather than showing zeros, so an unavailable metric is never mistaken for a real value of zero.