- Task
- Version · 6.0
- Measure
Analyze patterns in policy failures over time
Last updated: September 29, 2026
Work back from a moving pass rate to the rule behind it, then decide whether that rule is catching real risk.
Before you begin
Contact us to enable Change Intelligence.
Your teams have been running policy checks for longer than the time range you plan to look at. Each tile compares the current period against earlier periods of the same length, so a few days of history cannot show a 30-day trend.
Procedure
Start from the direction, not the number
Every tile on the Policy Checks dashboard carries the current window plus up to three earlier windows of the same length. Read Pass Rate and Critical & Blocker across those windows first. A pass rate that is falling while violation counts climb is a different problem from one that is falling because coverage just widened onto databases nobody had checked before.
So check the two coverage figures in the same pass. See Measure governance effectiveness.
Narrow to one rule
The Policy Checks dashboard filters by Check and by Severity, so you can isolate a single rule and see every operation it flagged in the window.
Note: Check and Severity filter the operations list only. The tiles above the list keep describing the set without them, so they will not move as you narrow. The tiles also do not rank checks by how often they fail, which is why isolating a rule and reading its operations is the way to find the one generating the most work.
The Check picker is built from the checks that have actually recorded a violation in your workspace, so it is empty until a policy check reports one. It does not require the governance capability to be set up.
Read the severity spread
Each operation in the list carries a Severity column of five pills, in a fixed order of Info, Minor, Major, Critical, and Blocker, each with the count of violations at that severity. Scanning the column down a filtered list is the fastest way to see whether one rule is producing a steady trickle of low-severity findings or occasional blockers.
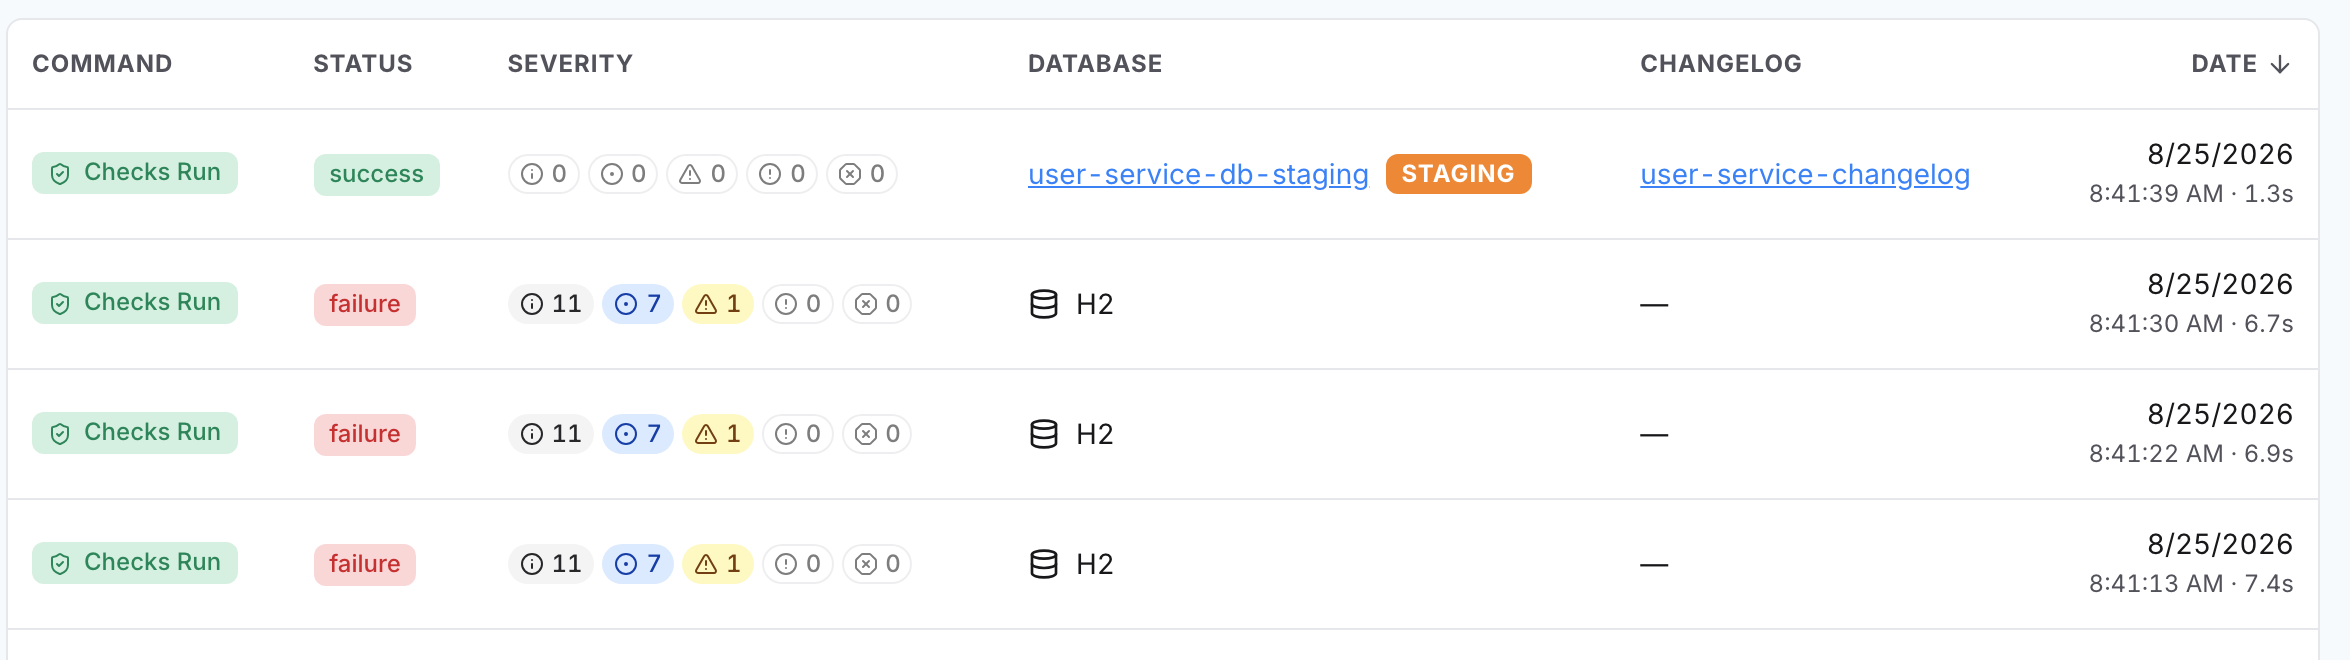
Note: The pills are counts rather than an outcome. A row of zeros shown as muted outlines means the operation ran checks and found nothing, while a dash means the operation carries no policy check report at all. Those are different states and only the second one is a gap.
Open an operation and choose a Findings tab
Open any operation from the filtered list to reach its details page. Findings groups the same results two ways, and which one you want depends on the question.
Tab | Answers |
|---|---|
By Severity | What was flagged, worst first. Use it when you are deciding what to fix. |
By Check | Which checks ran at all and how each was configured. Use it when you are deciding whether the rule itself is right. |
Decide whether to recalibrate or fix
A rule that fires constantly at low severity across every team is usually miscalibrated rather than widely violated. A rule that fires rarely but at blocker severity is doing its job. Recalibrating is a governance change, so make it in Browse the policy catalog, and record what you expect to happen so the next window tells you whether it worked.