- Task
- Version · 6.0
- Measure
Measure governance effectiveness
Last updated: September 29, 2026
The Policy Checks dashboard reports how much of your estate is under policy and how often it passes.
Before you begin
Contact us to enable Change Intelligence.
Policy checks are assigned and running against at least one database or changelog. Operations that evaluate no checks are left out of these figures entirely.
Procedure
Open the Policy Checks dashboard
Under Monitor, open Policy Checks. The window follows the time range you select and defaults to 30 days. The same six figures appear on the Operations Dashboard, always over the last 30 days.
Read the figures
The metrics section sits above the operations list, laid out three tiles across.
Read them in pairs. The violation counts tell you volume, Critical & Blocker tells you how much of that volume is urgent, and the two coverage figures tell you how much of the estate any of it describes.
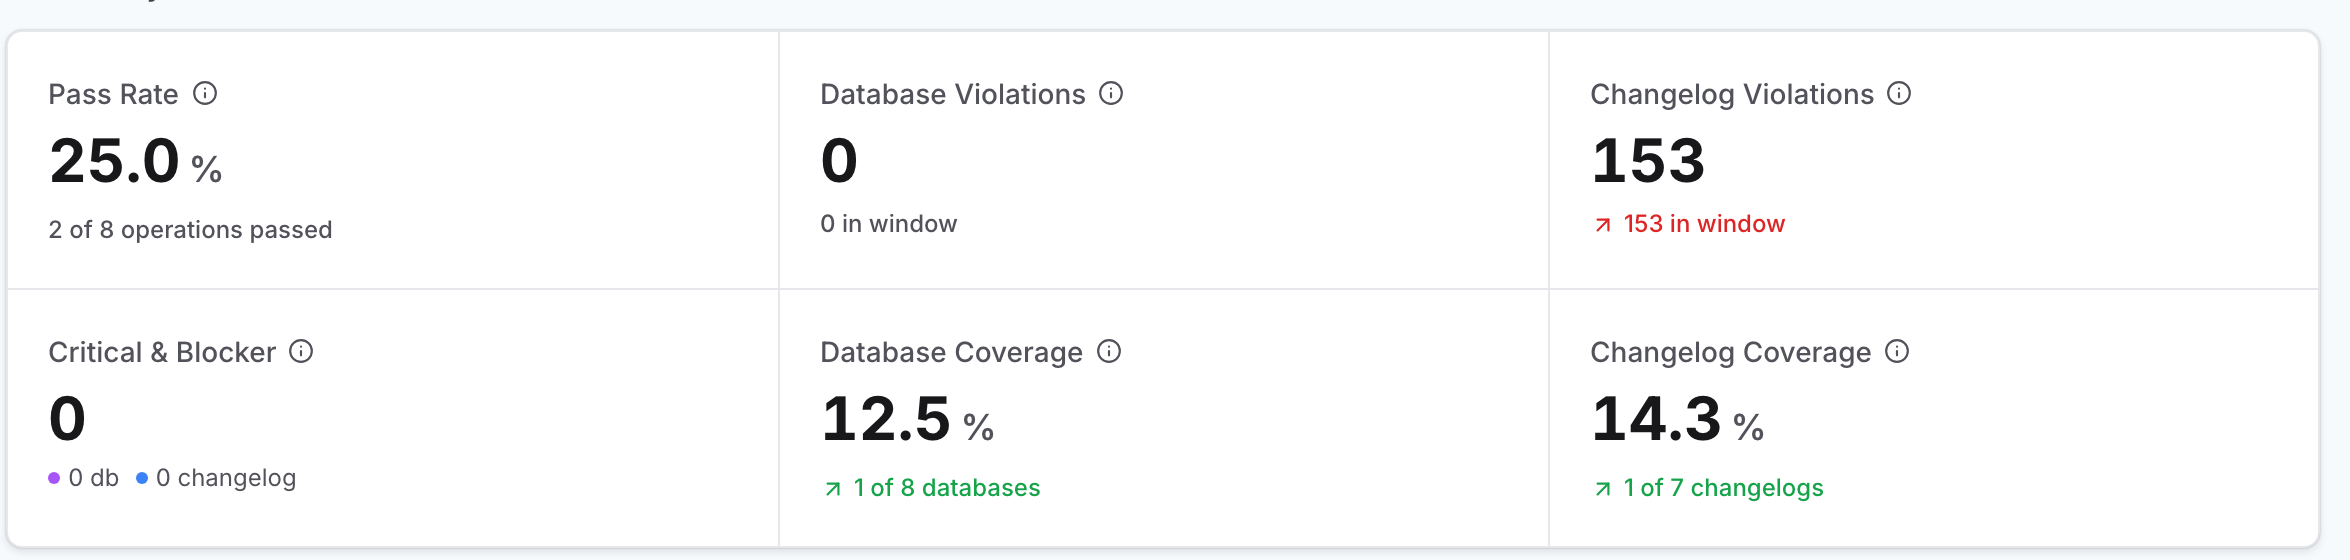
Metric | Description |
|---|---|
Pass Rate | Share of operations that executed at least one check and had no violation at |
Database Violations | Cumulative count of violations from database-scope checks in the window. |
Changelog Violations | Cumulative count of violations from changelog-scope checks in the window. |
Critical & Blocker | Cumulative count of violations at |
Database Coverage | Unique databases with at least one policy-checks operation in the window, over all registered databases. Archived databases are excluded from both sides of the ratio. |
Changelog Coverage | Unique changelogs with at least one policy-checks operation in the window, over all registered changelogs. Archived changelogs are excluded from both sides of the ratio. |
Check what counts as a pass
Pass Rate is the figure most often misread, because both the top and the bottom of the fraction are narrower than they look.
An operation passes when nothing it found rose above info severity. A run that returns a page of informational findings still counts as a pass. Only a violation at minor or higher makes it a failure.
Only operations that actually ran a check are counted. Deployments with no policy checks assigned are left out of both sides, so they neither help nor hurt the rate.
Read Pass Rate against coverage
Because unchecked work is invisible to Pass Rate, the rate on its own does not tell you how much is governed. A pass rate of 100 percent across a quarter of your databases is a smaller claim than it looks, and the two coverage figures are what tell you which case you are in.
Both coverage figures divide by everything registered and not archived, not by everything you meant to check. So a connection you registered but never intend to check holds the figure down permanently. Archive what you no longer use, and to raise coverage deliberately, widen where your checks apply in Define policy assignments.