- Concept
- Version · 6.0
- Monitor
What are policy check results?
Last updated: September 29, 2026
What policy check results are, and what the policy checks dashboard and details screens show.
Policy checks run at execution time, in the CLI and your automation, and their results are reported to the server like any other operation. This is where those results are reviewed across the organization. You can see which checks ran, what they found, and which deployments they affected.
The policy checks dashboard
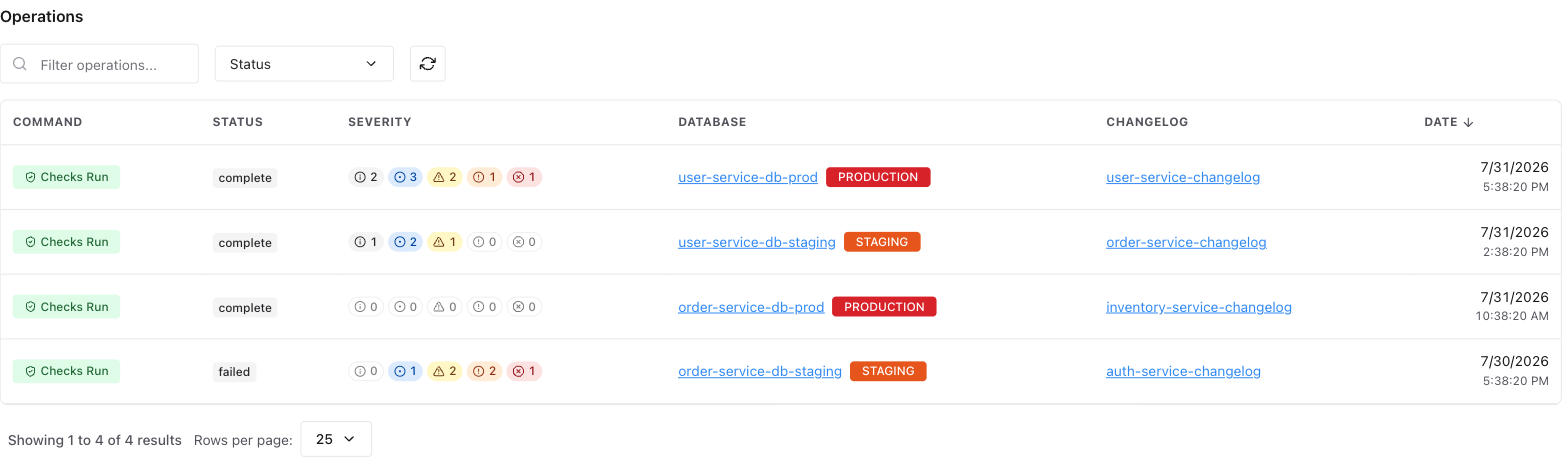
Lists policy check operations across the workspace with severity indicators, filterable by project, connection, and period, so recurring violations and their sources stand out.
The policy checks details page
One check run in full. It shows the checks executed, each result and severity, and the deployment and database context. Defining and configuring the checks themselves happens in Govern database changes. This page shows what happened when they ran.

The Policy Checks dashboard
What are policy checks?
Policy checks are automated governance rules that evaluate your changelogs and database changes against your organization's standards. They can enforce requirements such as changeset comments, naming conventions, or restrictions on destructive operations like dropping tables or columns without conditions.
When you run liquibase checks run, Liquibase evaluates each changeset in your changelog against your configured checks and reports a result for each one. The reporting extension captures those results automatically and surfaces them here. No extra steps are required beyond having the extension configured.
Learn more about policy checks in the Liquibase documentation.
Blocking and non-blocking outcomes
Each policy check has a severity level configured in Liquibase. How that severity affects the operation status depends on how the checks are configured: Liquibase determines whether a violation causes the checks run command to exit with a failure, and that exit code is what the server reflects as the operation status.
In practice, higher-severity violations (such as those configured as blockers) cause checks run to fail, which can block a CI/CD pipeline from proceeding. Lower-severity violations may result in a warning or still allow the command to succeed. The exact behavior depends on your Liquibase checks configuration. See the Liquibase policy checks documentation for details on configuring severity and exit behavior.
What determines which checks appear
The checks captured in the server are determined by your Liquibase checks settings configuration, specifically which checks are enabled and how they are configured on the Liquibase side. The server captures whatever checks run reports; it does not add or modify checks. See the Liquibase policy checks documentation for information on enabling, customizing, and managing checks.
The Policy Checks dashboard
The Policy Checks dashboard opens with a Policy Check Metrics section, followed by a list of individual policy check operations. Both the metrics and the list reflect the current filter bar selection.
The metrics section summarizes policy check health across the filtered set. For what each of the six figures counts and what actually qualifies as a pass, see Measure governance effectiveness.
Operations list
The operations list shows all policy check operations captured by the extension. You can search for operations using the Filter operations search bar and narrow the list using the Status dropdown filter.
Liquibase Secure 6.0 adds a full filter bar to this view, with saved views and shareable filtered URLs. See Filter activity by project, pipeline, database, or environment for how filtering works.
The Status field reflects the outcome of the checks run command as reported by Liquibase, not simply whether violations were found. A success status means the command completed without errors. A warning or failure status reflects Liquibase's own exit code, which is determined by your checks configuration, such as whether any triggered checks are configured to block on violation.
Severity pills
Each operation in the list shows a Severity column: a row of five pills, one per severity bucket, in a fixed order of Info, Minor, Major, Critical, and Blocker, with Blocker rightmost. Each pill carries an icon, a severity color, and the number of violations at that severity for the operation. Hover a pill to see its severity name and count.
The pills are counts, not an outcome. Status remains the headline indicator of whether the operation passed, since it reflects Liquibase's exit code rather than a violation tally.
Pills with a count of zero stay in place, shown as a muted gray outline instead of a severity color, so the row keeps the same shape on every operation and a given severity is always in the same position.
Two states differ from a normal row of counts:
An operation with no policy check report at all shows a dash rather than a row of zeros. This happens for operations captured before policy check reporting was available.
An operation that reports violations without a per-severity breakdown shows a single total count in place of the five pills. This happens with older versions of the reporting extension, which send a violation total without the severity detail.
To investigate violations on a specific run, select the operation to open its detail page.
Operation fields
Field | Description |
|---|---|
Command | The Liquibase command that ran, such as |
Status | The result of the operation as reported by Liquibase: |
Severity | Violation counts for the operation, broken out into the five severity buckets. See Severity pills. |
Database | The database connection the operation ran against. |
Changelog | The changelog associated with the operation. |
Date | The date and time the operation ran, with the duration shown alongside it. |
The Policy Checks details page
Selecting a policy check operation from the Policy Checks dashboard opens its detail page. This page shows which checks passed, which had violations and their severity, and which changeset triggered each violation.
If you ran your operation with the --reports-enabled flag, an HTML report is also available. Select View Report in the top right corner to open it.
Header
The header identifies the operation on one row: the operation type Policy Checks as the title, a Checks Run badge naming the command that ran, a status badge (success, warning, or failure), and the operation's short id, with View Report at the right.
Directly beneath that, a context line gives the operation's key entities at a glance:
Field | Description |
|---|---|
Database | The database connection the checks ran against. |
Changelog | The changelog the checks were evaluated against. |
Project | The project (or projects) the operation belongs to. |
Run by | The user who ran the operation, as reported by the Liquibase extension, such as a CI user or a person's command-line user. |
When the database, changelog, or project is registered in the server, its name links to that entity's page. An unregistered database shows its name as plain text without a link. Operations that didn't record a changelog, project, or runner show a dash in place of the missing value.
This header is the same on every operation type. See Header on the Operation Details page for the full description.
Operation summary
The Operation Summary card gives the run's timing and how much it covered. It sits at the top of the page, beside Outcome breakdown.
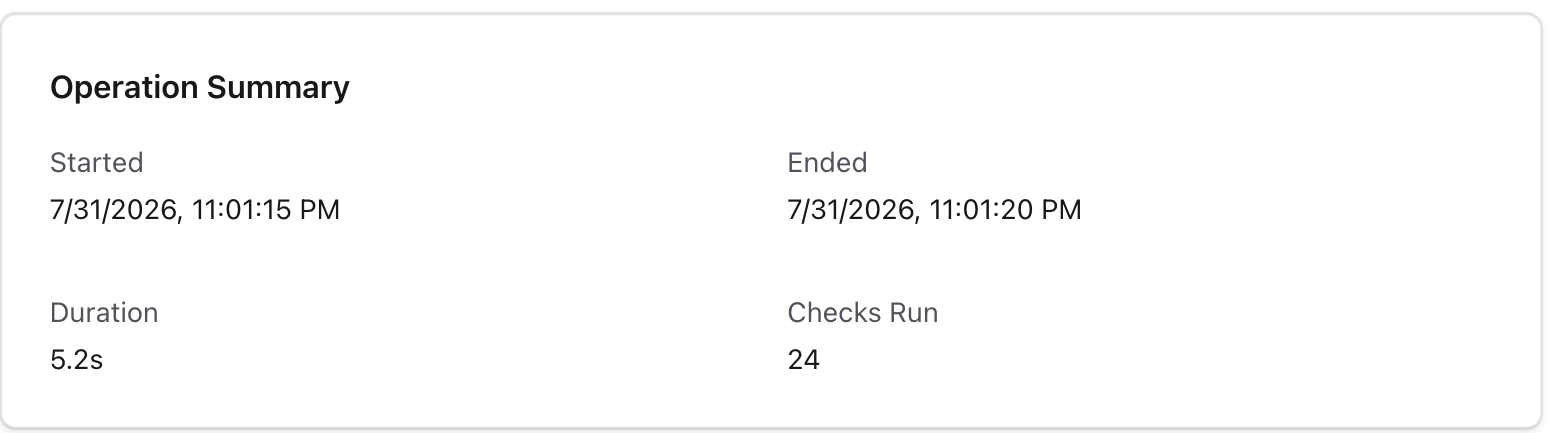
Field | Description |
|---|---|
Started | The date and time the operation started. |
Ended | The date and time the operation completed. |
Duration | How long the operation took to complete. |
Checks Run | How many checks the operation evaluated. |
On Policy Checks operations this card shows Checks Run where other operation types show a Deployment ID. A checks run does not deploy anything, so the deployment identifier carried no useful information here and the count of evaluated checks replaces it. Database Changes and Drift Detection operations still show their own Deployment ID.
Checks Run shows a dash rather than 0 when the operation's report does not carry a check count. An operation captured by an older extension may omit the count without having run zero checks, so the two cases are shown differently.
Outcome breakdown
The Outcome Breakdown card sits beside Operation summary. It shows the operation's outcome as a row of severity pills giving how many violations were found at each severity, labeled so you can read them without hovering. Below the pills, a caption gives the totals, such as 25 checks evaluated · 4 violations, or no violations for a clean run.
This is the same set of five severity buckets used on the Policy Checks dashboard, shown here for a single operation instead of a list. Pills with a count of zero stay in place rather than disappearing, so a given severity is always in the same position.
The card replaces the pass/fail affirmation this page previously showed, so the severity spread is visible whether or not the run found anything.
If the operation carries no policy checks data at all, the card reads No policy-checks data for this operation. This happens with operations captured before policy check reporting was available, and is not an error.
AI analysis
If AI Analysis is enabled on your account, the AI Analysis card appears on every Policy Checks operation, including runs where every check passed.
Two actions are available:
Summarize is always offered, and describes what the run did.
Analyze issues appears only when there is something to diagnose: when the operation status is not
success, or when the run has at least one violation atminorseverity or higher. A run that passed with onlyinfo-level violations does not get this button.
Generation runs in the background, so you can navigate away and come back to it. The card reads Generating in background… while it works, and the finished result does not expand on its own.
Results are kept separately for each action, so a summary and an issue analysis can both be present at once. Each one shows the model that produced it and when it was last analyzed, including the user who triggered it when that is known.
Selecting an action again re-runs it. The previous result moves into Previous Analyses, grouped as Summary and Issue analysis, so earlier output stays available.
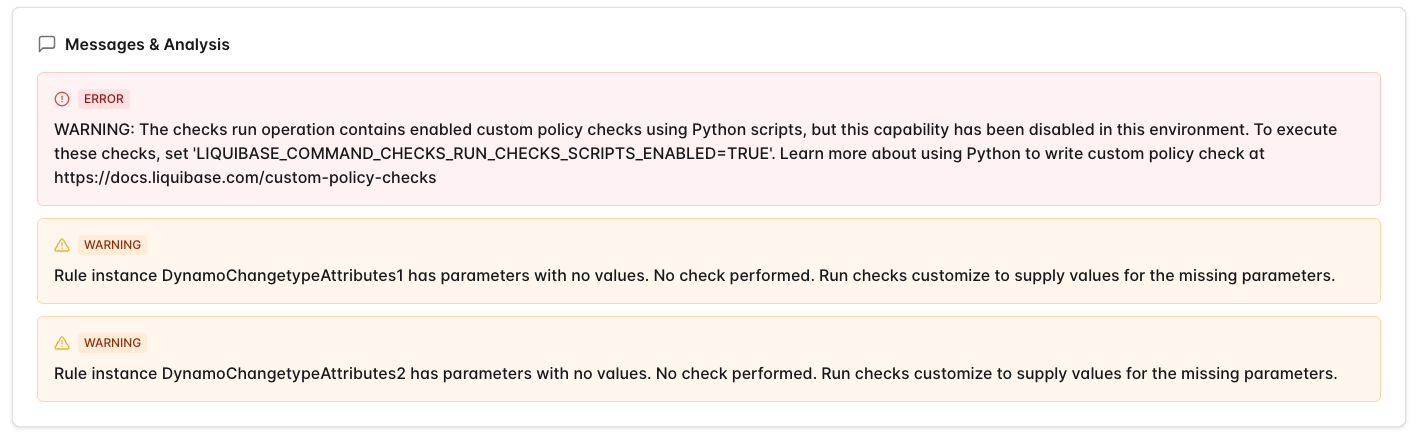
Messages & analysis
Shows warning and error messages from the operation logs, such as misconfigured checks, disabled features, or checks that could not run. These are runtime messages about the execution environment, not policy violation results. Policy violations are shown separately in Findings. If AI Analysis is enabled on your account, AI-generated summaries appear in the AI analysis card above.
Findings
Findings is the primary content of a checks run. It presents the operation's results across four tabs, each with a count badge.
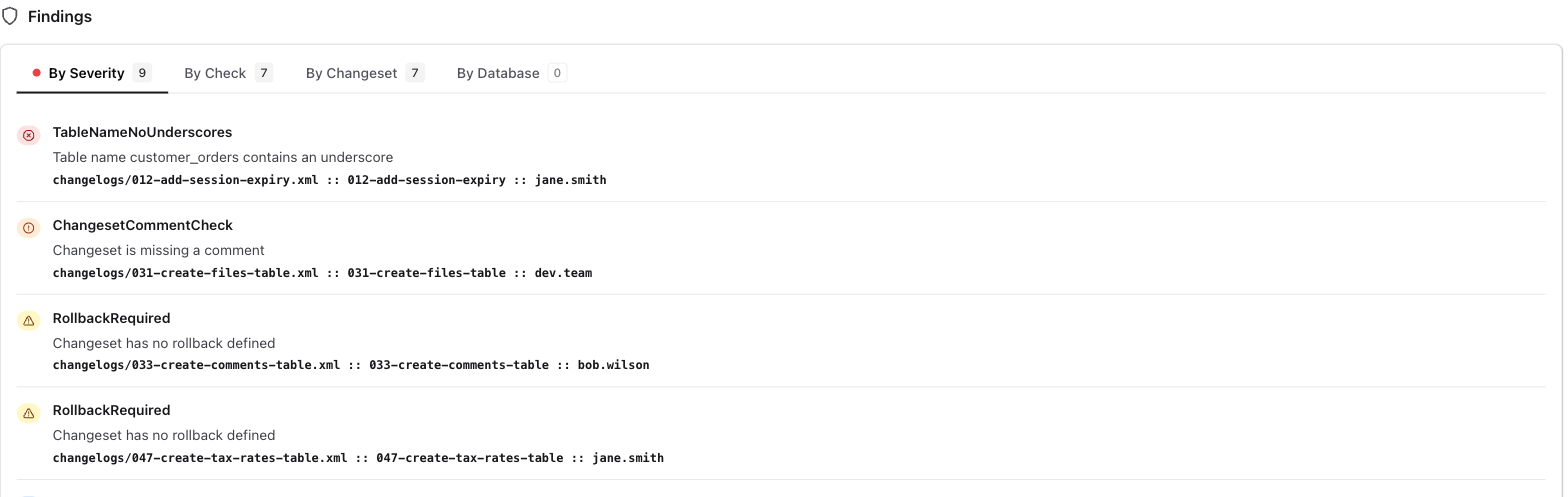
Tab | Shows | Badge counts |
|---|---|---|
By Severity | Violations grouped by severity, highest severity first. Each item shows the severity pill, the check name, a description of what the check requires, the flagged changeset or database object, and the source file and line. | Flagged items |
By Check | Every check that ran, including checks that flagged nothing. Each row shows the check name, its configured severity, its scope ( | Checks executed |
By Changeset | One row per changeset flagged by at least one check, with the changeset's three-part identifier and a summary of the violations against it. | Flagged changesets |
By Database | One row per database object flagged by at least one check, with the object identifier and a summary of the violations against it. | Flagged objects |
By Check is an inventory rather than a violation list. It answers "what did this run actually check?" instead of "what failed?", which is why its badge counts the checks executed rather than the items flagged.
Which tab you land on depends on the results. By Severity opens when the operation has any violations, and By Check opens otherwise, so a clean run starts on the inventory of what was checked. When By Severity has results it carries a red dot, so you can tell the operation had violations without switching tabs.
Tabs with no results stay visible but de-emphasized rather than disappearing, which keeps the layout consistent across operations. By Database is empty on many operations, because most checks are changelog-scoped.
Long lists are shortened with a Show all control, and Show fewer collapses them again. No item is hidden without a way to reach it.
View Report opens the HTML report produced by the CLI, when the extension uploaded one with the operation.
An empty By Check tab
If By Check shows a 0 badge and no rows while the other tabs have results, the operation was captured by an older version of the reporting extension that does not send the executed-check inventory. Update the extension to populate this tab. This is expected with an older extension and is not an error.
Investigating and resolving a failure
To investigate a failure, start on the By Severity tab in Findings. Each violation identifies the check that triggered, the severity, and the exact changeset or database object responsible, along with the source file and line.
Read the description for each violation to understand what the check requires. Then locate the changeset in your changelog and update it to meet the requirement. For example, a ChangesetCommentCheck violation means the changeset is missing a required comment; adding one and re-running checks run resolves it.
To see whether a check ran at all, or how it was configured, switch to By Check and expand the check's row. This is also where you confirm that a check you expected to run was actually enabled.
Whether a violation blocks the pipeline depends on how the check is configured in Liquibase, not on the severity label shown in the server. A violation will continue to appear in future runs until it is addressed in the changeset.
If AI Analysis is enabled, select Analyze issues in the AI Analysis card for AI-powered suggestions on resolving violations.
Database details
The Database Details card shows the connection the operation ran against.
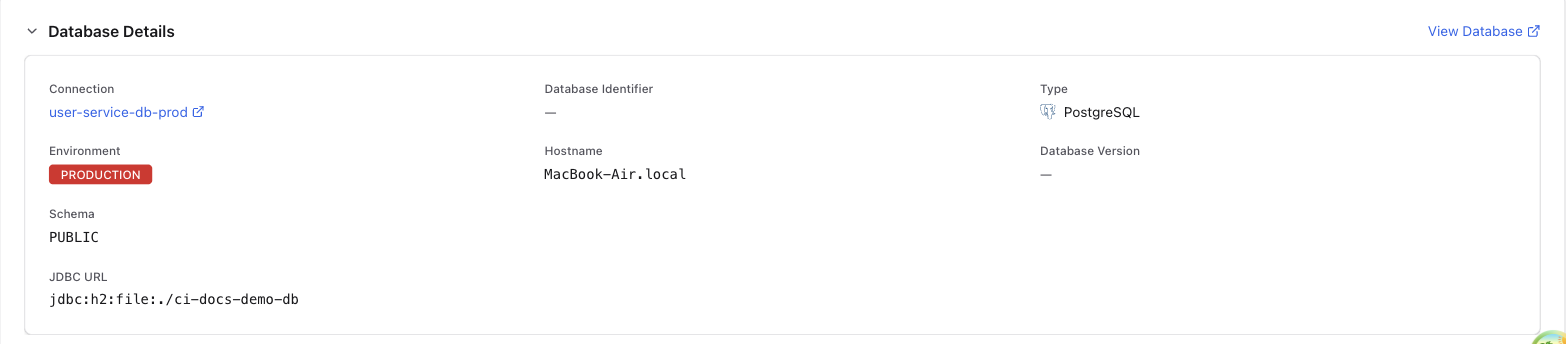
Field | Description |
|---|---|
Connection | The database connection the operation ran against. When the database is registered in the server, the name links to its connection page. For an unregistered database, the field shows the reported database name as plain text, or |
Database Identifier | The name of the target database, when reported. |
Type | The database type (for example, PostgreSQL), shown with its logo. |
Environment | The environment of a registered connection (for example, Production), when one is set. |
Hostname | The hostname of the database server. |
Database Version | The database server version, when collected. |
Schema | The schema the operation targeted, shown only when the operation reports one. |
JDBC URL | The full connection URL the operation used. |
When the database is registered in the server, the section header carries a View Database link to its connection page.
Changelog details
Directly below Database Details, a collapsed Changelog Details section describes the changelog the checks ran against, including its format, changeset count, project, and registration details. When the operation is attributed to a registered changelog, the section header carries a View Changelog link.
This section is the same one used on Database Changes operations and behaves identically here. See Changelog details on the Operation Details page for the full field list and fallback rules.
Properties
A collapsed Runtime Summary section listing the configuration that was actually in effect for the checks run. These are the effective values, not the literal command line. Sensitive values such as passwords and tokens are stripped at the Liquibase extension before anything is sent, so the server never receives or stores them and they cannot be revealed in the UI.
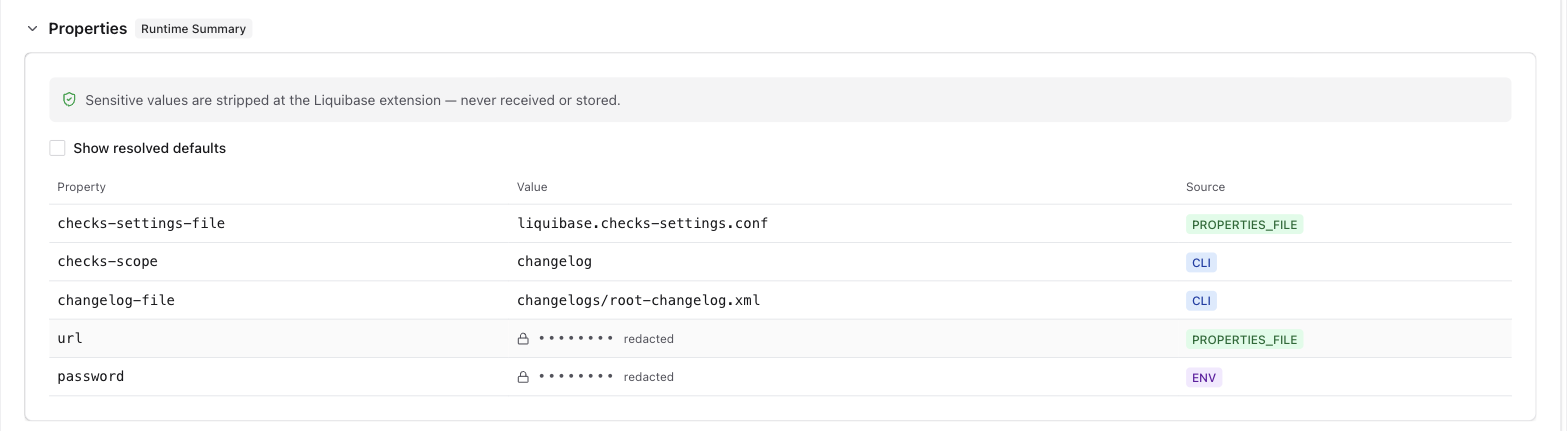
This section behaves the same on every operation type. See Properties on the Operation Details page for the full description.
The literal command line is no longer shown. If you ran the operation with --reports-enabled, the full Liquibase HTML report is still available from View Report in the page header.
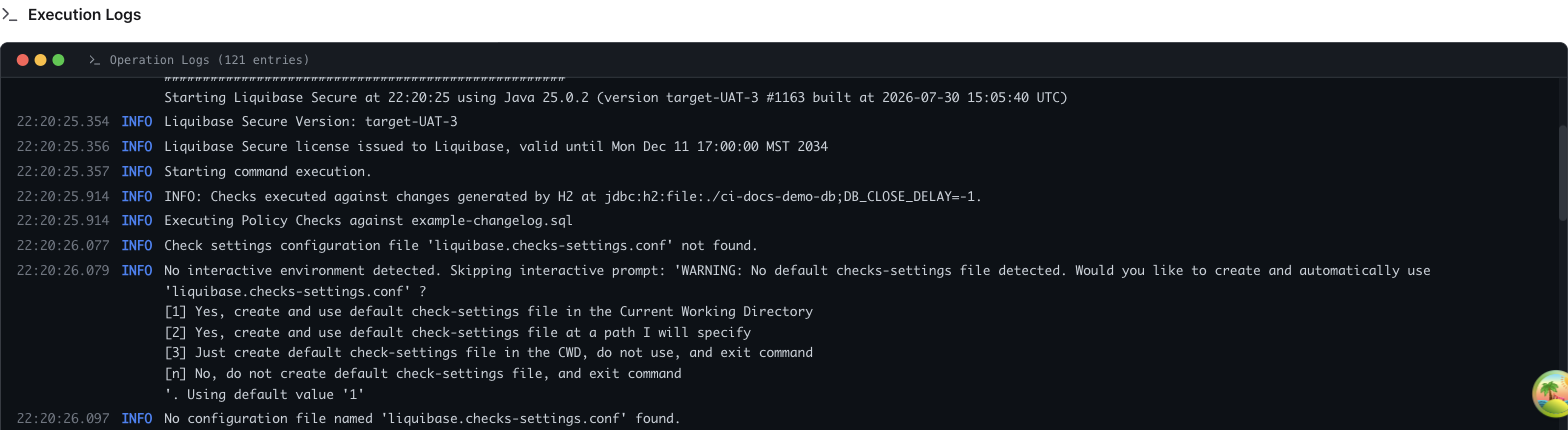
Execution logs
Shows the full execution logs captured during the operation, providing a complete audit trail of everything that occurred during the checks run.