- Concept
- Version · 6.0
- Monitor
View policy execution
Last updated: September 29, 2026
Scan policy check runs across your organization. See when they ran, against what, and how they ended.
Every policy check run your teams execute is reported to the server as an operation. Each record shows when it ran, which changelog and database it ran against, and how many checks passed, warned, or failed. The Policy Checks views list these executions so you can scan governance activity the same way you scan deployments.
Read the metrics
The view opens on a row of six summary cards, three across, above the operations list. They cover the same filtered set as the list, so narrowing the filters narrows the cards with it.
Pass Rate and the two coverage cards are percentages. Database Violations, Changelog Violations and Critical & Blocker are counts, and Critical & Blocker also splits its count by whether the check was database-scoped or changelog-scoped.
Every card is windowed, and the label above the row names the window in use. The window comes from the filter bar's time range: the last 7, 30, or 90 days, a custom range, or all time, defaulting to the last 30 days. A preset also shows the current window beside up to three earlier windows of the same length, so a value reads as a trend rather than a single number. A custom or all-time range is a single window, so no comparison appears.
Note: An information icon on each card carries that metric's full definition, and a card with no data in the window shows an em dash rather than a zero. The exact definitions are in Measure governance effectiveness.
Read the operations list
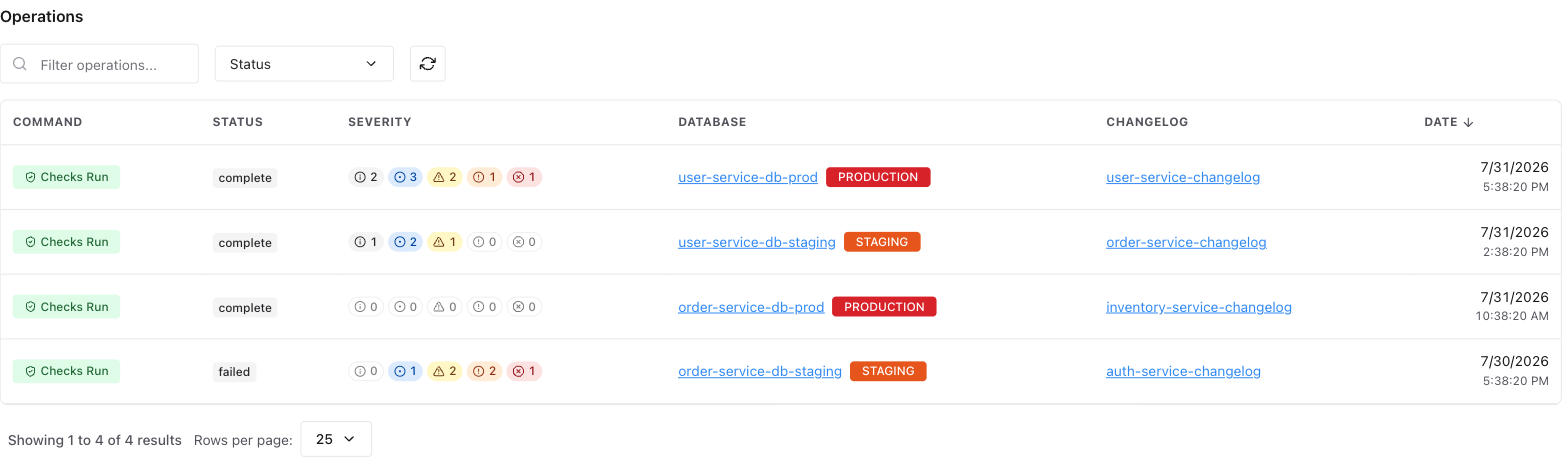
Each row shows the command, its status, the violation counts by severity, the database and changelog it ran against, and when it ran. Search with the Filter operations bar and narrow the list with the Status dropdown.
The Status field reflects the outcome of the checks run command as reported by Liquibase, not simply whether violations were found. A success status means the command completed without errors. A warning or failure status reflects Liquibase's own exit code, which is determined by your checks configuration.
Open an execution
Select an operation to open its detail page. It shows which checks passed, which had violations and their severity, and which changeset triggered each violation. The layout and every field are described in What are policy check results?.
