- Concept
- Version · 6.0
- Monitor
Review an operation’s details
Last updated: September 29, 2026
What every field on the operation details page tells you, from status and command to the execution logs and the changesets a deployment applied.
The Operation Details page provides a full record of a single Liquibase operation: what ran, which database it ran against, and what happened to each changeset. You can reach it by selecting any operation from the All Operations list, the Database Changes dashboard, or from a changelog's operations history.

Header
The header identifies the operation on one row: the command that ran as a bold title, a command badge (an icon and label, colored by command family), a status badge (success, warning, or failure), any outcome badges that apply to the operation type, and the operation’s short id. A drift check, for example, adds a Drift or Clean badge. View Report sits at the right of the same row, and opens the Liquibase HTML report when the run was made with --reports-enabled.
Each command family has its own badge color, so you can tell what a run did without reading the title. Commands the server does not recognize fall back to a neutral badge showing the command name.
Command | Badge | Family |
|---|---|---|
| Update | Database change |
| Update SQL | Database change |
| Rollback | Rollback |
| Rollback SQL | Rollback |
| Checks Run | Policy checks |
| Diff | Drift detection |
| Diff Changelog | Drift detection |
| Snapshot | Drift detection |
| Changelog Sync | Sync |
Directly beneath that, a context line gives you the operation's key entities at a glance:
Database — the database connection the operation ran against.
Changelog — the changelog it deployed.
Project — the project (or projects) it belongs to.
Run by — the user who ran the operation, as reported by the Liquibase extension (for example, a CI user or a person's command-line user).
When the database, changelog, or project is registered in the server, its name links to that entity's page. An unregistered database shows its name as plain text without a link. Older operations that didn't record a changelog, project, or runner show a dash (—) in place of the missing value. On narrow screens the context line wraps onto additional rows rather than truncating.
If you ran your operation with the --reports-enabled flag, an HTML report is also available. Select View Report in the top right corner to open it. When no report was generated, the button is disabled.
Operation summary
The Operation summary card shows when the operation ran and how long it took.
Field | Description |
|---|---|
Started | The date and time the operation started. |
Ended | The date and time the operation completed. |
Duration | How long the operation took to run. |
Deployment ID | A unique ID for cross-referencing this operation with your logs. |
Outcome breakdown
The Outcome breakdown card summarizes what happened to the changesets in the deployment, using the same buckets as the Outcome pills on the Database Changes dashboard: Run, Previously run, Filtered out, and Failed deployment. A caption below the pills shows how many changesets were evaluated and which changelog they came from.
Some operations carry no update summary. Operations recorded before this feature was released, operations run with a non-update command, and operations where the summary was suppressed show No outcome data for this operation. instead of pills.
AI analysis
The AI Analysis card offers AI-generated explanations of the operation. It appears when AI Analysis is enabled for your workspace (Manage in the card links to the setting).
Two actions are available:
Summarize — always available. Generates a plain-language summary of what the deployment did.
Analyze issues — available when the operation did not finish cleanly, that is when its status is warning or failure, and also when a run that reports
successcarries policy check violations at minor severity or higher. Diagnoses what went wrong and suggests how to fix it.
Generation runs in the background. While an analysis is running, the card shows a status indicator; the result does not open on its own. When it finishes, expand the result to read it. Selecting an action again re-runs it.
Each analysis is saved with the operation, so a later visit shows the most recent result along with the model used, when it ran, and, where known, who triggered it. When both a summary and an issue analysis exist, both are shown. The Previous Analyses list keeps the full history, grouped by type.
Changesets
The Changesets section breaks the operation's changesets into four tabs. Each tab shows a count badge; a tab with no results stays visible but muted rather than being hidden.
Tab | What it shows |
|---|---|
Run | Changesets that were deployed in this operation. A changeset that was rolled back during the operation appears here with a rolled back annotation, because it did run. |
Filtered out | Changesets excluded by label or context filters. |
Failed | Changesets that errored. The row shows the failure reason where it is available. |
Not deployed | Changesets that were not deployed because an earlier failure ended the operation. |
The Database Changes dashboard shows a single combined Failed deployment pill. This page splits that count into two tabs: Failed (changesets that actually errored) and Not deployed (changesets that were skipped because a prior changeset failed and stopped the run).
The tab that opens first is the first one with results, in the order Failed, Run, Not deployed, Filtered out. Each tab shows its first few changesets, with a Show all control to load the rest.
Note: Per-changeset details for the Filtered out and Not deployed tabs aren't sent by the Liquibase client yet. For now those tabs show their count with a short note, and Filtered out also lists the filter categories that applied. Full per-changeset detail for these tabs arrives in a future update.
Messages
Shows warnings and errors surfaced during the operation. This section appears only when the operation produced messages.
Database details
A collapsed section describing the database the operation ran against. Expand it to see:
Connection — the connection name. When the database is registered in the server, the name links to its connection page. For an unregistered database, the field shows the reported database name as plain text, or
Unknownwhen the operation didn't report one.Database Identifier — the name of the target database, when reported.
Type — the database type (for example, PostgreSQL), shown with its logo.
Environment — the environment of a registered connection (for example, Production), when one is set.
Hostname — the database host.
Database Version — the database server version. Populated for Policy Checks operations from the checks report; other operation types show a dash until this data is collected in a future release.
Schema — the schema the operation targeted, shown only when the operation reports one.
JDBC URL — the full connection URL the operation used.
Fields with no reported value show a dash (—).
When the database is registered, the section header also carries a View Database link to its connection page, so you can open it without expanding the section.
If the database isn't registered in the server, the section header shows an Unregistered badge and the panel displays a short notice with a Register database button. Registering the database lets the server track its operations and metadata over time.
Changelog details
A collapsed section describing the changelog the operation deployed. Expand it to see:
Changelog — the changelog name. When the changelog is registered in the server, the name links to its page.
Format — the changelog format (for example, XML, SQL, YAML, or JSON).
Changesets — the number of changesets in the changelog.
Project — the project (or projects) the changelog belongs to, each linking to its page.
Last Updated — when the changelog's registered details were last modified in the server.
Path — the changelog file path, when recorded.
The Format, Path, and Last Updated fields come from the changelog's registration record in the server, which you manage from the changelog's page. Deployments don't update them automatically. If you rename or reformat a changelog file, edit the registered changelog details to match.
Any field that the server hasn't recorded shows Not recorded. A changelog with zero changesets shows a count of 0, not Not recorded. Operations that ran without changelog metadata, such as older operations, show the section with a short note that no changelog was recorded, rather than hiding it.

The Changelog details section appears on both Database Changes and Policy Checks operations and behaves the same on each.

When the operation is attributed to a registered changelog, the section header also carries a View Changelog link to that changelog's page, mirroring View Database on the Database details section. Operations with no recorded changelog show no link.
The section fetches its details the first time you expand it, so expect a brief loading state on first open. Collapsing and expanding it again shows the details immediately.
Properties
A collapsed Runtime Summary section listing the properties that were actually in effect for the run. These are the effective configuration, not the literal command line. Each property shows its resolved value, and where the Liquibase extension reports the origin, a Source column tags it as CLI flag, env var, properties file, or default. Sources the server does not recognize are shown as reported.
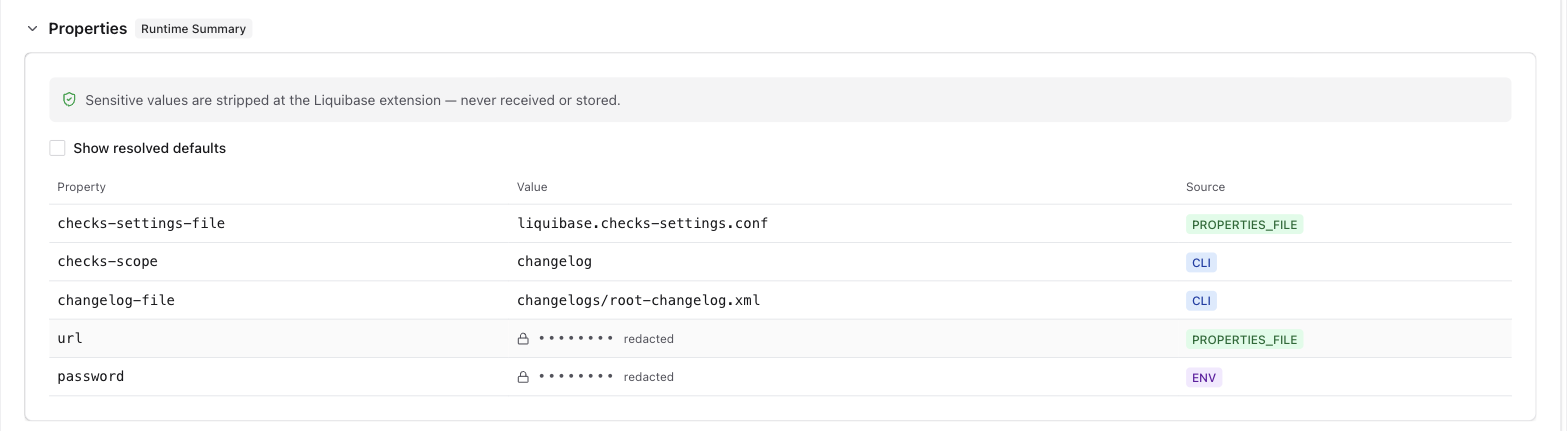
By default the panel lists only the properties that were explicitly set. When the operation's data includes values that came from Liquibase's resolved defaults, a Show resolved defaults checkbox appears; select it to add those default-valued properties to the table.
Sensitive properties are protected as a security feature. Values such as passwords, tokens, and license keys are stripped at the Liquibase extension before anything is sent, are never received or stored by the server, and cannot be revealed in the UI. Redacted properties appear in the table with a lock indicator in place of the value.
The literal command line is not shown here. If you ran your operation with --reports-enabled, the full Liquibase HTML report remains available from View Report in the page header.
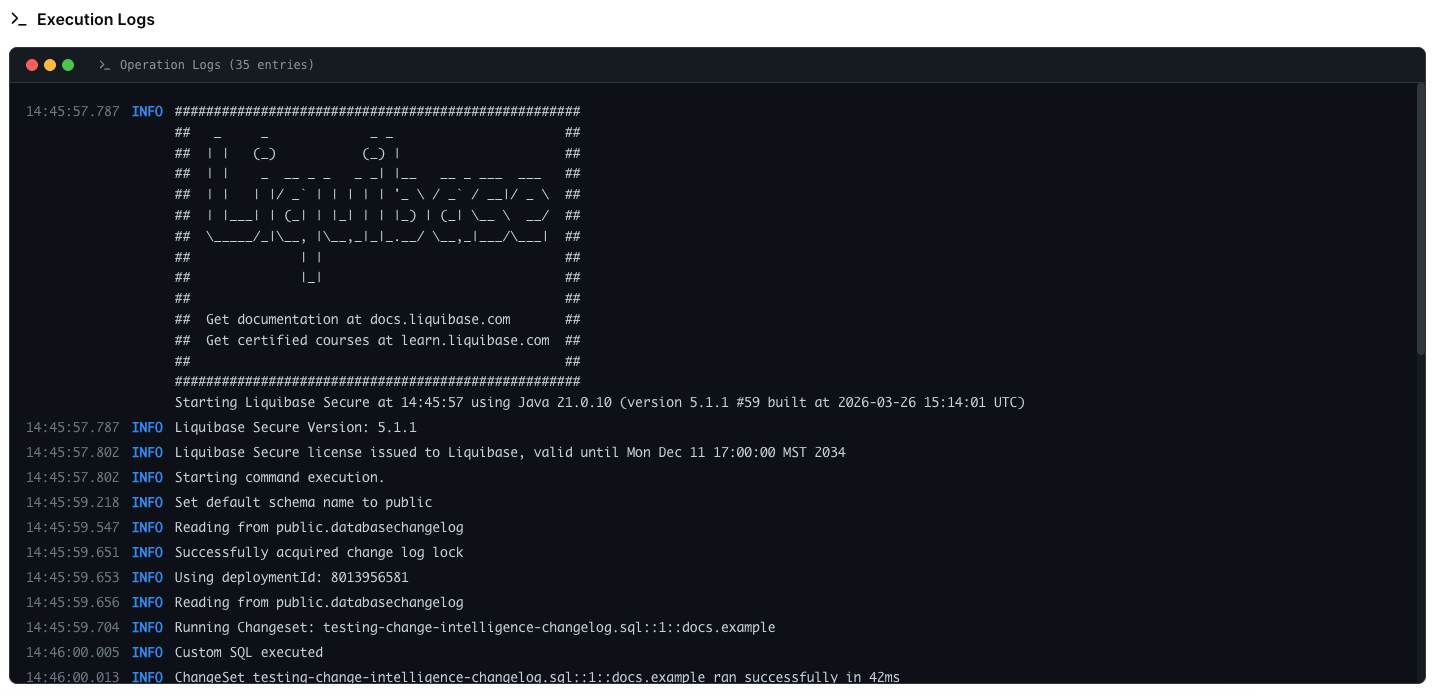
Execution logs
Shows a full audit log of everything that occurred during the operation, captured line by line as Liquibase ran.