- Concept
- Version · 6.0
- Monitor
View database deployments
Last updated: September 29, 2026
Scan, filter, and interpret recent Liquibase activity across your organization.
The Operations dashboard
The Operations Dashboard is the first view you see after logging in to the server. It presents a high-level summary of deployment health and compliance status across your entire workspace. Use it to:
Spot increases in change failure rate or rollback rate that may indicate pipeline instability
Track whether policy check pass rates are improving or degrading over time
Open the Drift Detection dashboard to review what recent drift checks found
Navigate the dashboard
The left sidebar organizes the dashboard into four sections.
Overview
Page | Description |
|---|---|
Dashboard | An at-a-glance view of database operations health across your environments, including DORA deployment metrics and policy check results. |
Operations
Page | Description |
|---|---|
Database Changes | Liquibase |
Policy Checks | Results of Liquibase policy check runs, including violations and warnings. |
Drift Detection | Results of drift detection runs that compare the expected database state against what is actually deployed. |
All Operations | A combined view of every operation across all types. |
Manage
Page | Description |
|---|---|
Groups of changelogs and database connections organized by application, service, or team. | |
All changelog repositories connected to your account, with changeset history and policy check status. | |
Database Connections | The database connections registered in your account. |
Dashboard metrics
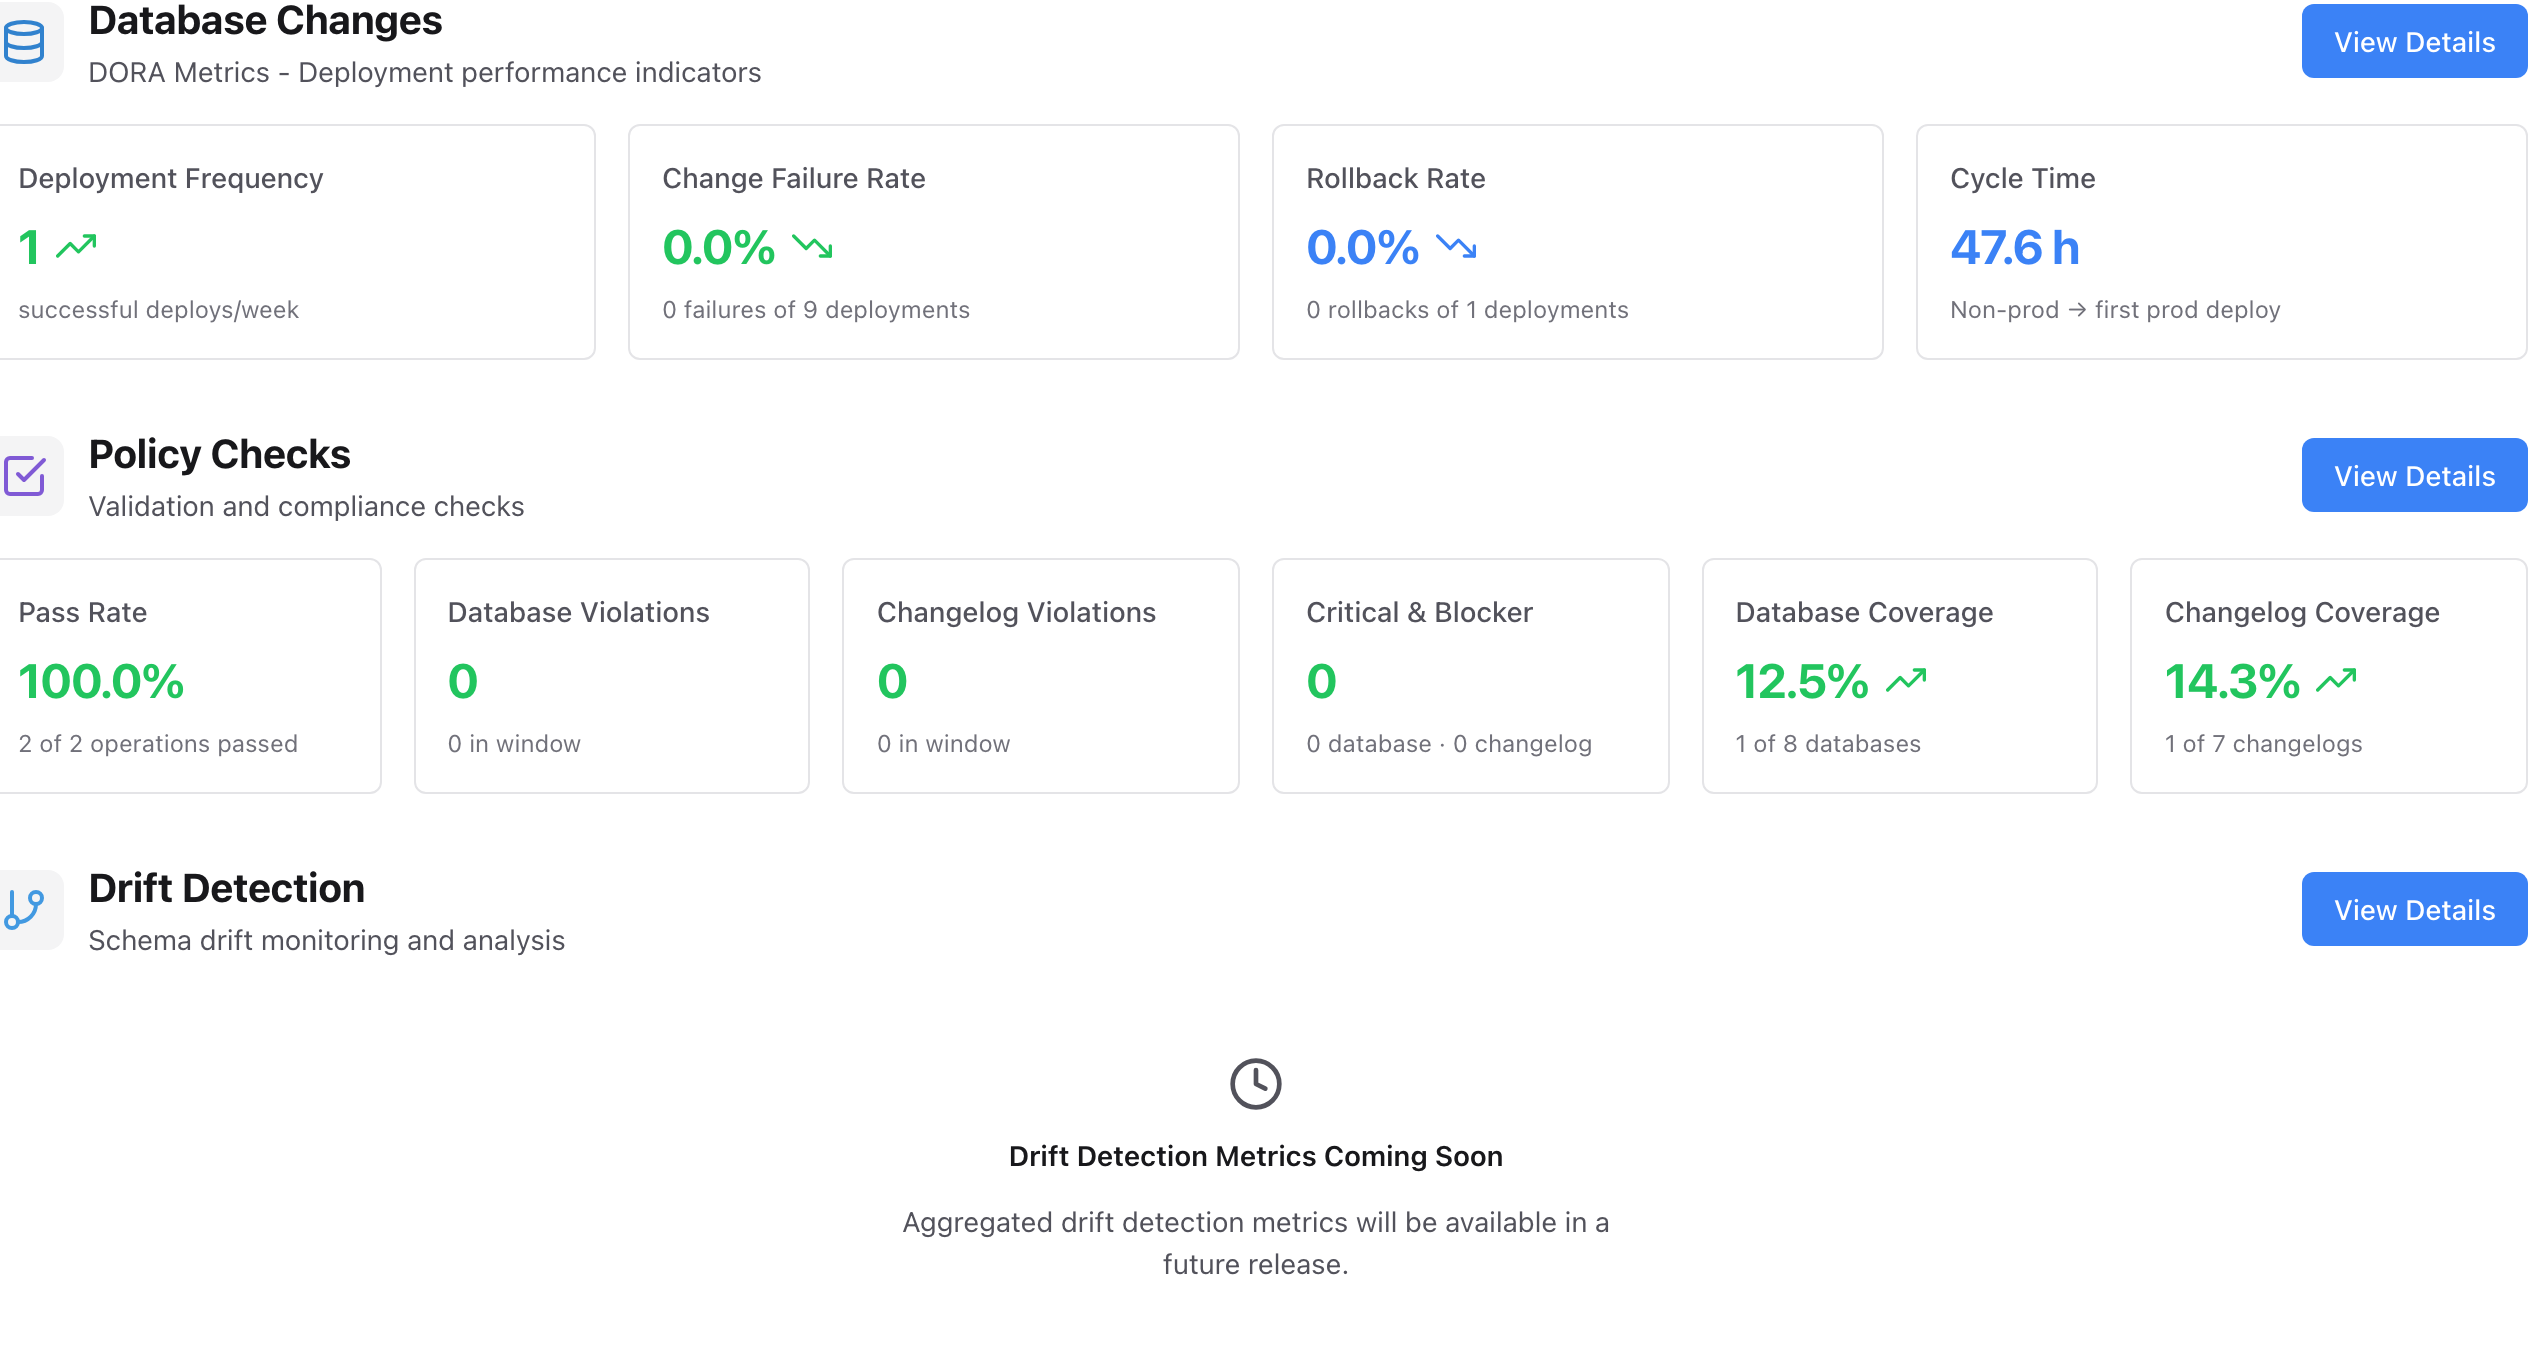
The dashboard is organized into three sections, one for each category of Liquibase operation. Each section has a View Details link to the full operations list for that category. Database Changes and Policy Checks also show stat cards with their key metrics.
Database changes — DORA metrics
This section tracks the health and frequency of update, rollback, and related deployment operations.
Metric | Description |
|---|---|
Deployment Frequency | Successful deployments in the last 7 days, shown as a daily rate such as |
Change Failure Rate | The percentage of deployments that resulted in a failure. For example, "2 failures of 56 deployments." |
Rollback Rate | The percentage of deployments that were rolled back. For example, "2 rollbacks of 24 deployments." |
Cycle Time | The average time a change takes to travel from its first successful non-production deployment to its first successful production deployment, across changes that have reached production. For example, "32d 11h." |
Policy checks
This section tracks the results of checks run operations across your databases and changelogs.
Metric | Description |
|---|---|
Pass Rate | The percentage of policy checks that passed. For example, "63.9%, 72 checks." |
Database Violations | The count of violations from database-level policy checks. |
Changelog Violations | The count of violations from changelog-level policy checks. |
Critical & Blocker | The count of high-severity violations requiring immediate attention. |
Database Coverage | The percentage of databases that have policy checks enabled. For example, "17 of 20 DBs." |
Changelog Coverage | The percentage of changelogs that have policy checks enabled. For example, "4 of 4 CLs." |
Drift detection
The Drift Detection section covers operations that compare the expected schema against the actual state of your databases. Five metrics summarize what those checks found across the window you selected:
Metric | Description |
|---|---|
Drift Rate | The share of operations that detected drift, as a percentage. Only operations where the diff command succeeded technically are counted, so a run that failed for an unrelated reason cannot make the rate look better or worse than it is. |
Drift Detected | The number of operations in the window that detected drift. This counts operations, not databases, so ten checks of one drifted database count as ten. |
Total Drift Items | The number of distinct drift items in the window, deduplicated per database, so a long-standing drift does not inflate the total every time you check for it. |
Avg Drift Items | Total Drift Items divided by the number of operations that detected drift. Because the total is deduplicated per database, this is an average of distinct items rather than of raw per-run counts. |
Database Coverage | The share of your registered databases that drift detection has run against in the window. Drift Rate and Database Coverage read in opposite directions: a falling drift rate is good, and rising coverage is good. |
If the server cannot load these metrics, the tiles show an unavailable state rather than numbers. That indicates a problem retrieving the metrics, not an absence of drift.
Results for individual drift checks are available now. Select View Details to open the Drift Detection dashboard, which lists every drift check and what each one found.
The All Operations dashboard
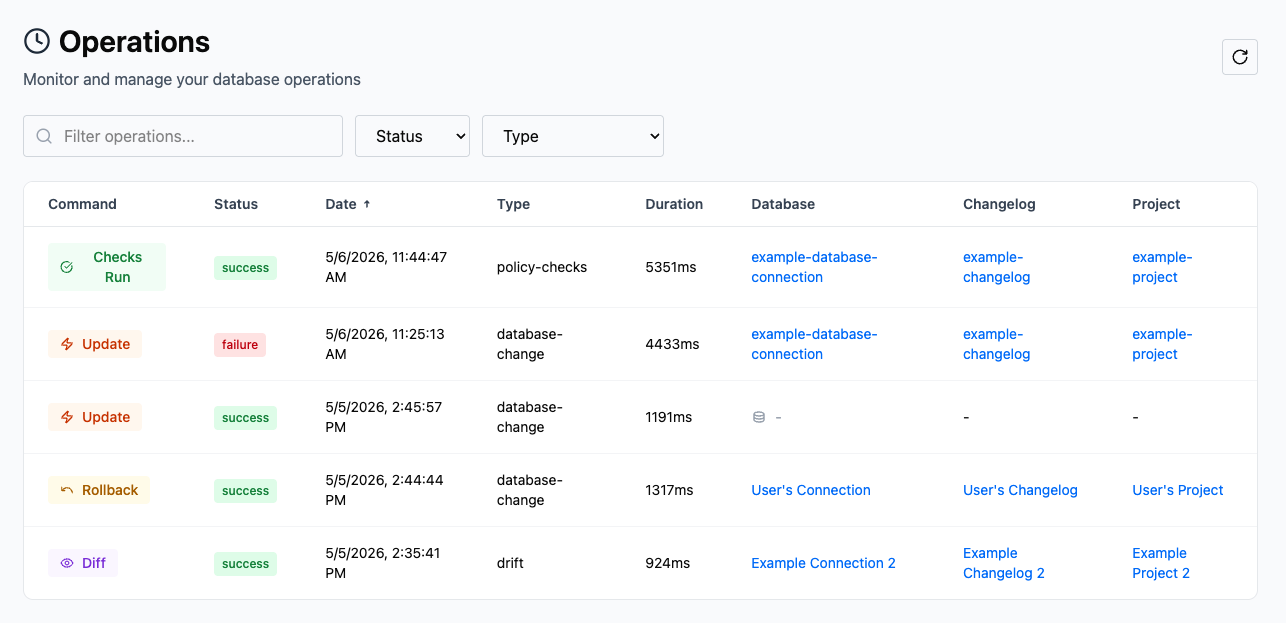
The All Operations dashboard gives you a centralized view of every Liquibase operation recorded across all your changelogs and projects, sorted by date with the most recent at the top. For each operation, you can see the command that ran, its status, the date and time it executed, the operation type, its duration, and the database, changelog, and project associated with it.
You can search for a specific operation using the Filter operations search bar, and narrow the list using the Status and Type dropdown filters.