- Concept
- Version · 6.0
- Monitor
Find successful and failed operations
Last updated: September 29, 2026
Use status to isolate failed operations, and work from the failure into the logs.
Every operation reported to the server carries a status of success, warning, or failure. The Status column shows it on every row of the All Operations list, so isolating failures is a filter, not a hunt.
Use the Status dropdown to narrow the list to failed runs, then filter by time period or database connection to find the run you are looking for. Status reflects whether the Liquibase command itself completed, as reported by Liquibase. For policy check and drift operations, read the outcome columns too. A drift check can succeed as a command and still find drift, and a checks run can pass with violations recorded.
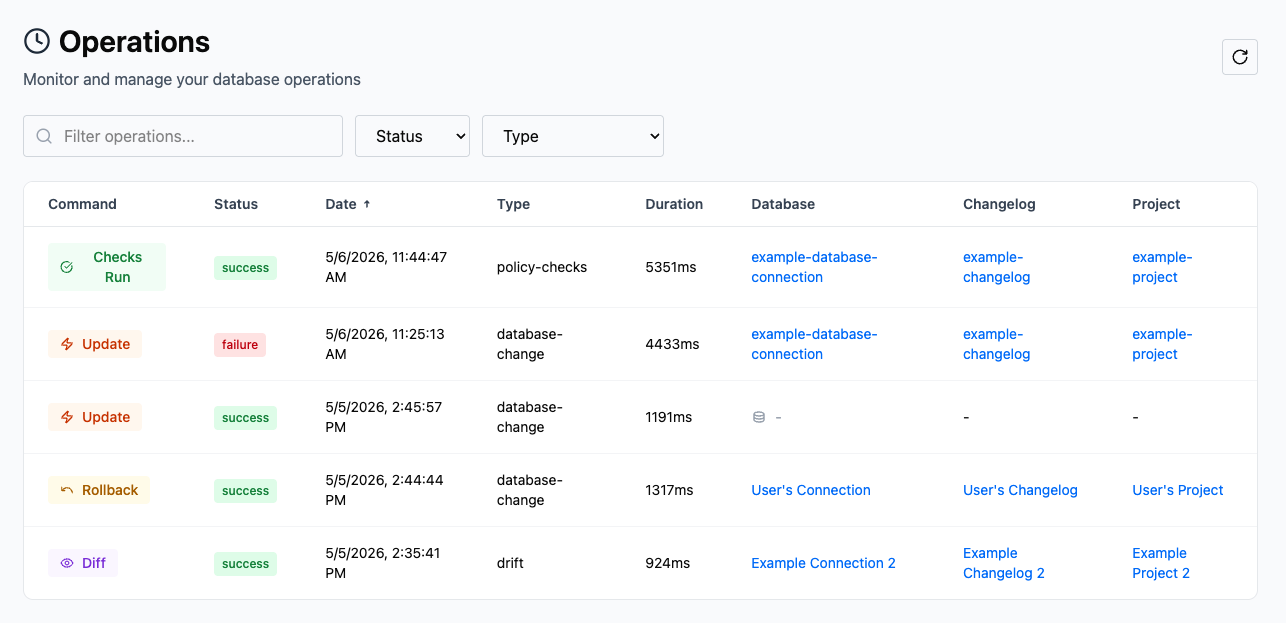
Work from the failure inward
Open a failed operation to see what stopped it. The operation details page shows the exact command, a status badge, and the changesets in execution order with their per-changeset outcomes.

The Changesets section separates what failed from what never ran. The Failed tab lists the changesets that errored, with the failure reason where it is available. The Not deployed tab lists the changesets that were skipped because an earlier failure ended the operation. Fix the failing changeset first. The not-deployed changesets usually run cleanly once it is resolved.
The Execution logs section shows everything that occurred during the operation, captured line by line as Liquibase ran. The failing changeset and its error appear in the log, timestamped.
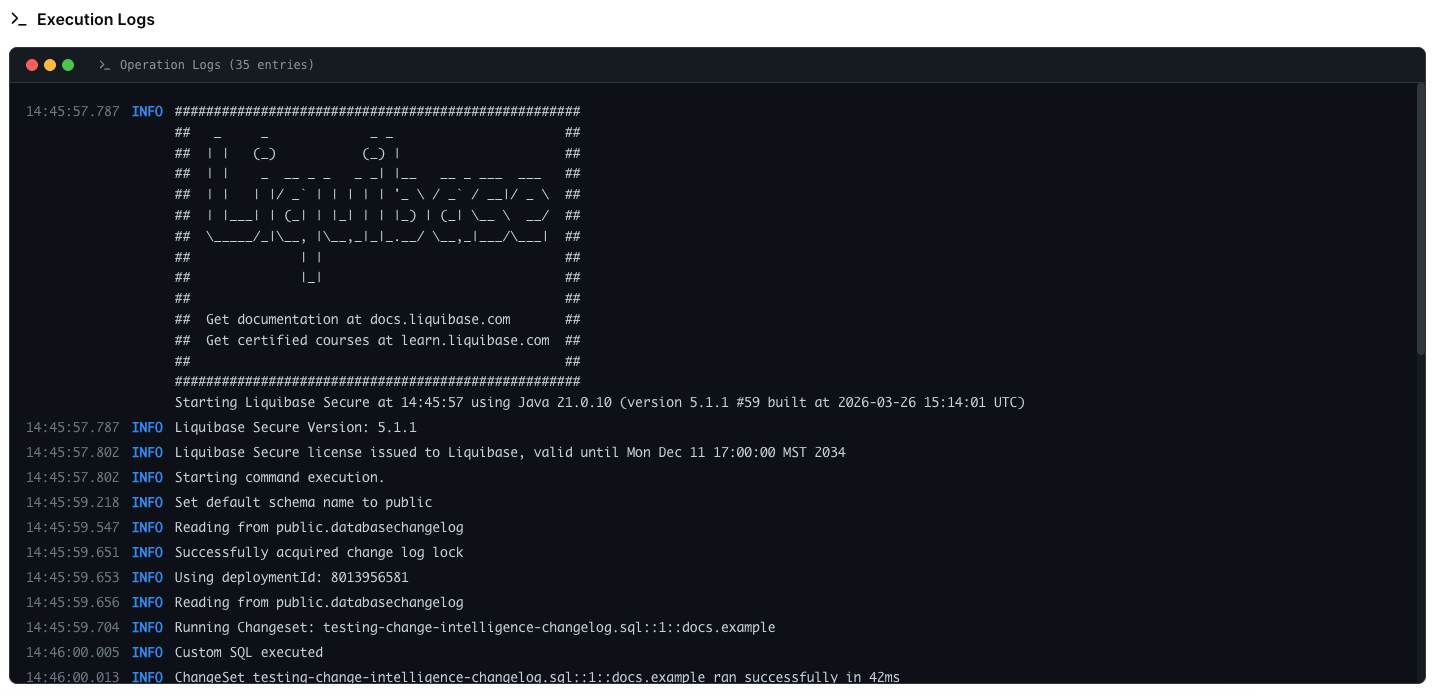
If an operation is missing
If an operation you expected is missing entirely, check attribution before assuming it never ran. Runs with mismatched identifiers are captured but unattributed. See Investigate an unattributed operation.