- Concept
- Version · 6.0
- Monitor
Review deployment history
Last updated: September 29, 2026
See which changes have been deployed to each database, and when.
The Database Changes dashboard shows all deployment operations run across your database connections. It includes DORA metrics and a full list of update and rollback commands run against your databases.
Liquibase Secure 6.0 adds a full filter bar to this dashboard, with saved views and shareable filtered URLs. See Filter activity by project, pipeline, database, or environment for how filtering works.
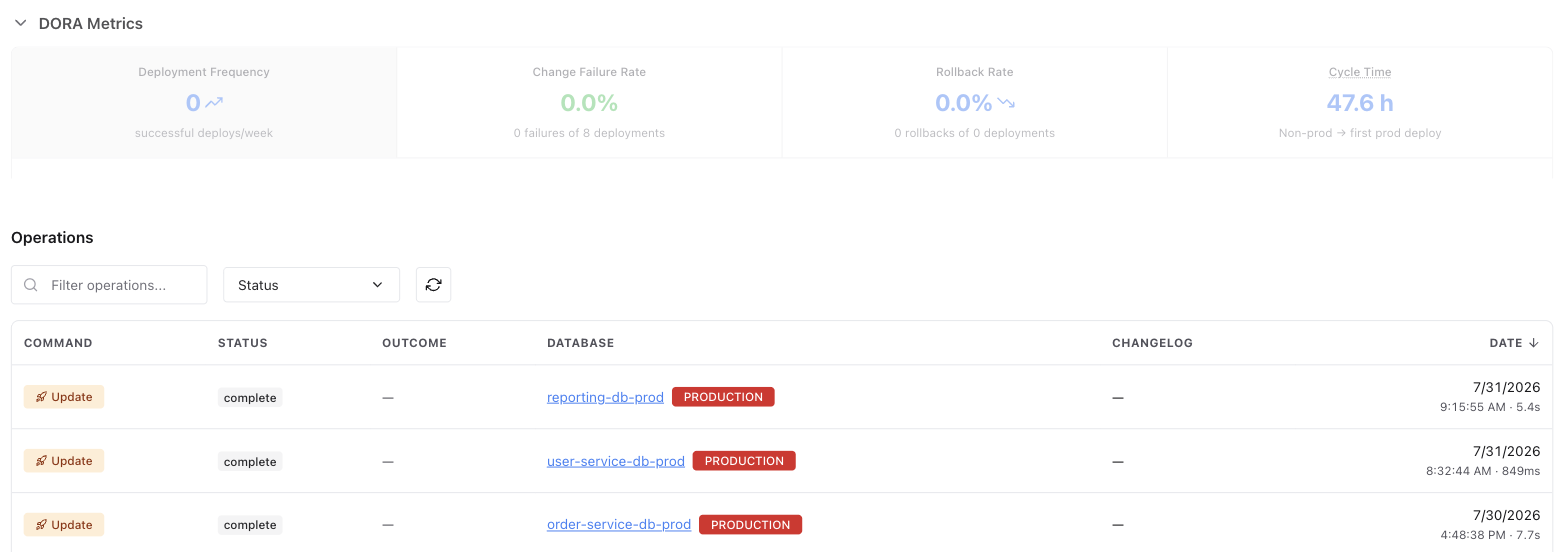
The top of the dashboard shows four deployment performance figures, including Cycle Time, with a trend chart below them. For what each one measures and how Cycle Time decides which changesets count, see Measure deployment performance.
Operation fields
Field | Description |
|---|---|
Command | A badge naming the Liquibase command that ran, such as Update, Rollback, or Rollback Count. A variant takes the color of the command family it belongs to, so every rollback reads as a rollback at a glance. |
Status | The result of the operation: |
Outcome | A breakdown of what happened to the changesets in the deployment, shown as pills. See Outcome buckets below. |
Database | The database connection the operation ran against. |
Changelog | The changelog associated with the operation. |
Date | The date and time the operation ran, along with how long it took. |
Every operation on this dashboard is a database change, so there is no separate Type column.
Outcome buckets
Each deployment row includes an Outcome summary, a set of pills that break down what happened to the changesets in that operation. The counts come from the Liquibase Update Report’s UPDATE SUMMARY, produced by the update command. The four pills always appear in the same order and position, so rows stay aligned as you scan the list, and each pill shows an icon with its count. Point at a pill to see its full label and count.
Bucket | Description |
|---|---|
Run | Changesets deployed in this operation. |
Previously run | Changesets that were already applied in an earlier run and skipped this time. |
Filtered out | Changesets excluded by label or context filters. |
Failed deployment | Changesets that were not deployed. This count combines changesets that errored and changesets that were not deployed because an earlier failure stopped the run. |
The Failed deployment pill is a single combined count of both cases. The Operation Details page splits this count into separate Failed and Not deployed tabs.
A bucket with no changesets still shows its pill, muted with an outline, rather than disappearing. A count of zero is information: it tells you nothing was filtered out or failed, which is different from an operation that carries no outcome data at all.
The Outcome column is specific to this dashboard. The All Operations, Policy Checks, and Drift Detection views do not show it, because outcome buckets describe a deployment’s changesets.
Note: Operations recorded before this feature was released, operations run with a non-update command (such as checks run or diff), and operations where the update summary was suppressed do not carry outcome data. Those rows show a dash in the Outcome column instead of pills.