- Task
- Version · 6.0
- Manage
Review license utilization
Last updated: September 29, 2026
See how many database targets your installation is actually using, which nodes reported them, and how that compares with the capacity your license grants.
Before you begin
You need to be a member of the Administrators group. Members of a group with the Security Reviewer template can open License Management, but the Utilization tab shows them no figures. See Liquibase Secure Role-Based Access Control.
At least one license file must be imported.
Change Automation nodes must be reporting to this installation. A node reports usage only when it reads its license from the license endpoint and has usage reporting turned on. A new installation has nothing to show until the first node reports. See License a Change Automation node.
Procedure
Open the Utilization tab
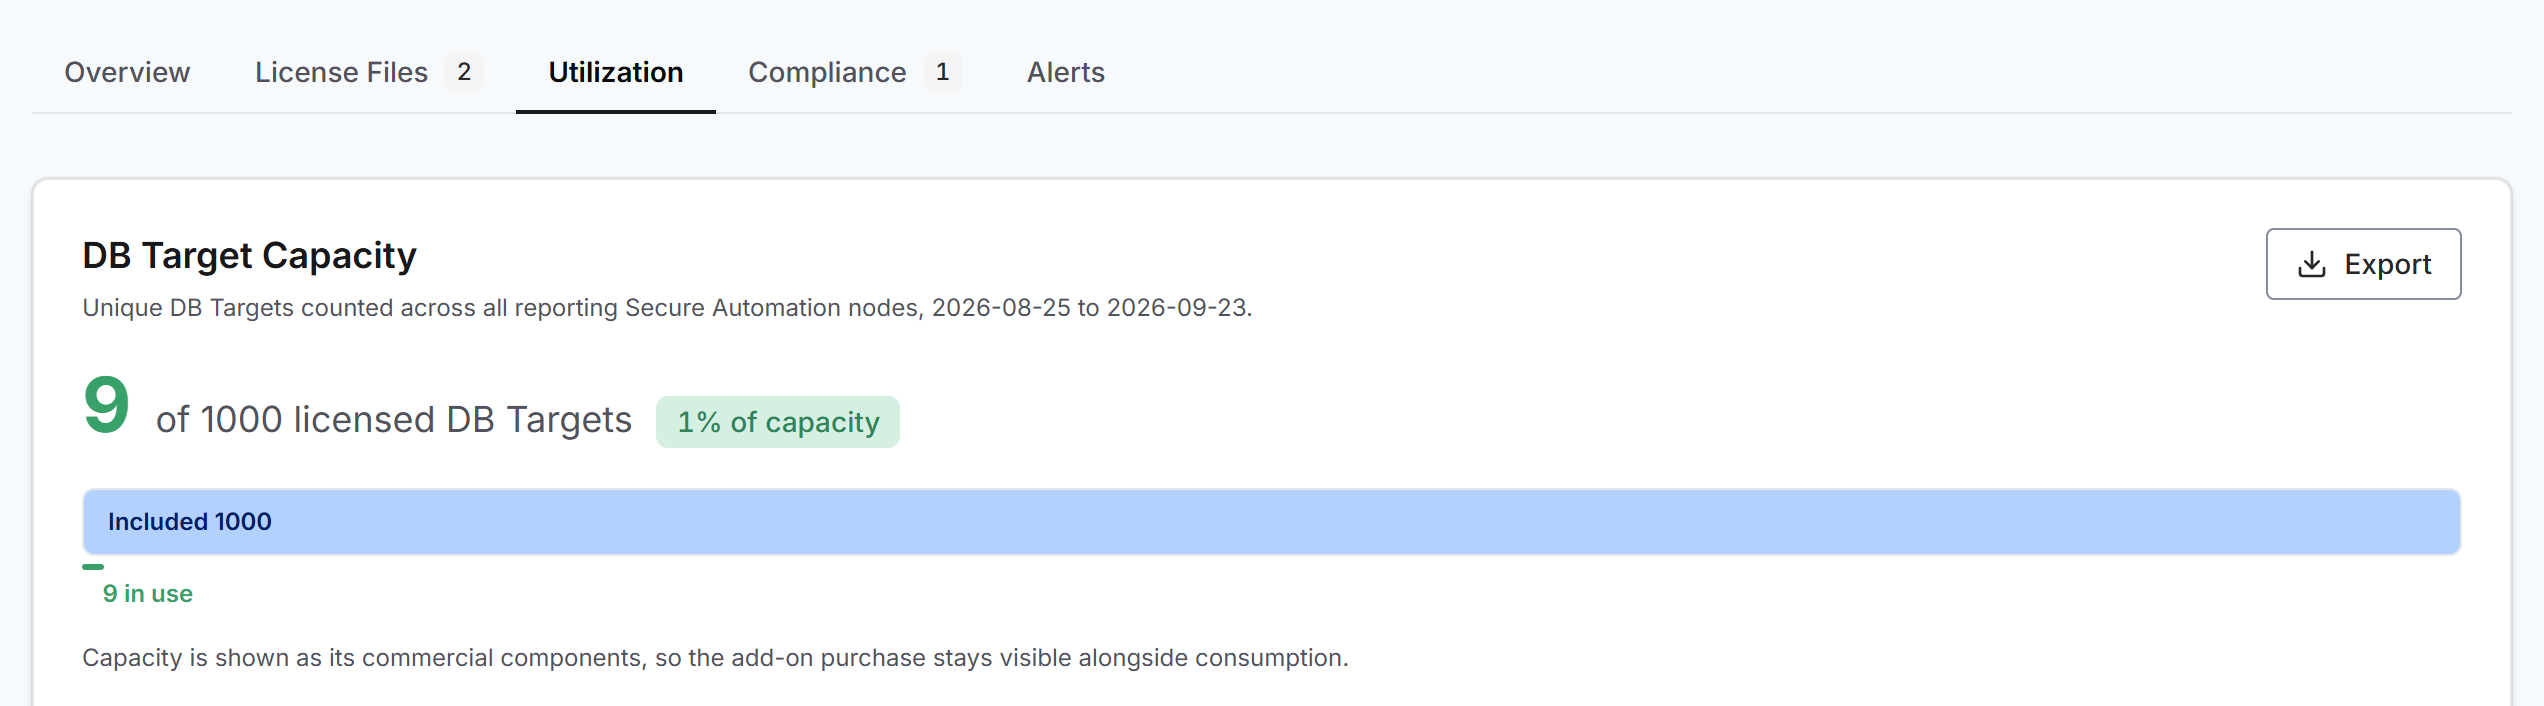
Go to Administer, select License Management, and open the Utilization tab.
Utilization sits beside the license rather than on a page of its own, because the figure only means something next to the capacity it is measured against.
The tab reports the trailing 30 days. That window is fixed on this screen.
Read capacity against the licensed total
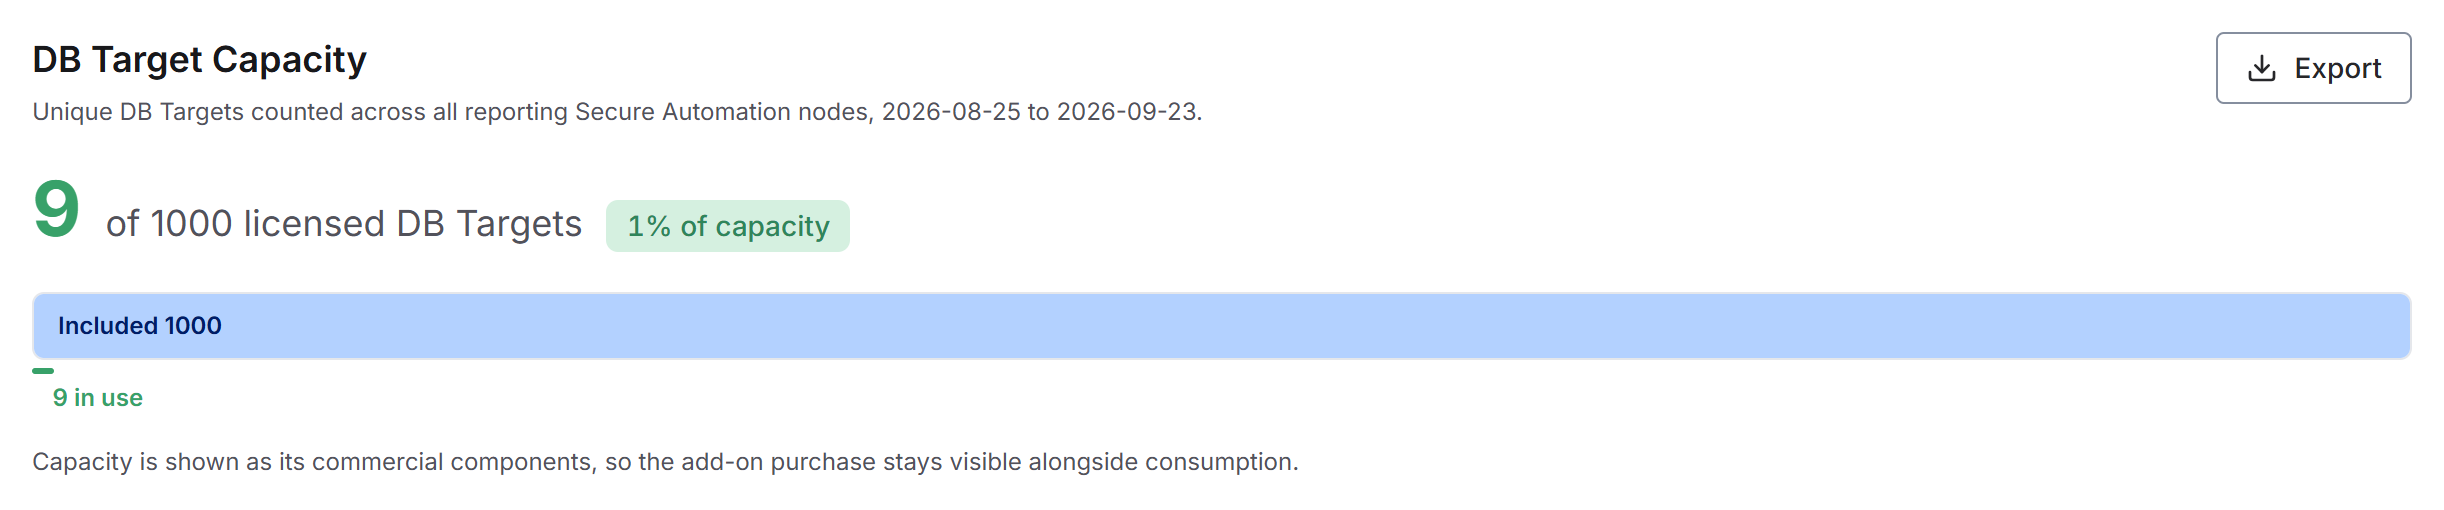
The DB Target Capacity card is the figure the screen exists to answer: how many distinct database targets were seen, against how many the license grants.
Your licensed capacity can come from more than one license file, so the card splits the total into two parts:
Included: the database targets that come with your base license, which is the license for your Liquibase Secure subscription.
Add-on: extra database targets you bought separately. They arrive in their own add-on license file and add to the capacity of your base license.
For example, a base license for 750 targets plus an add-on for 250 targets shows as Included 750 and Add-on 250, for a total of 1,000. If no add-on license is in effect, the card shows only the Included segment.
A consolidated license file works differently. Instead of giving you your base license and your add-ons as separate files, Liquibase can combine them into one consolidated file. Liquibase adds up the capacity before it signs the file, so the file holds a single total. The card shows that whole total as Included, even if part of it originally came from an add-on. For example, a consolidated file built from a 750-target base license and a 250-target add-on shows Included 1,000 and no Add-on segment.
If you later import a separate add-on file on top of a consolidated file, that add-on does appear as its own Add-on segment. To see which files make up your license, see Review the effective license.
If usage exceeds the licensed capacity, the installation is in an explicit out of contract state. Nothing stops working. It is a contract term to resolve with your Liquibase account team, not an outage.
Read the two breakdowns
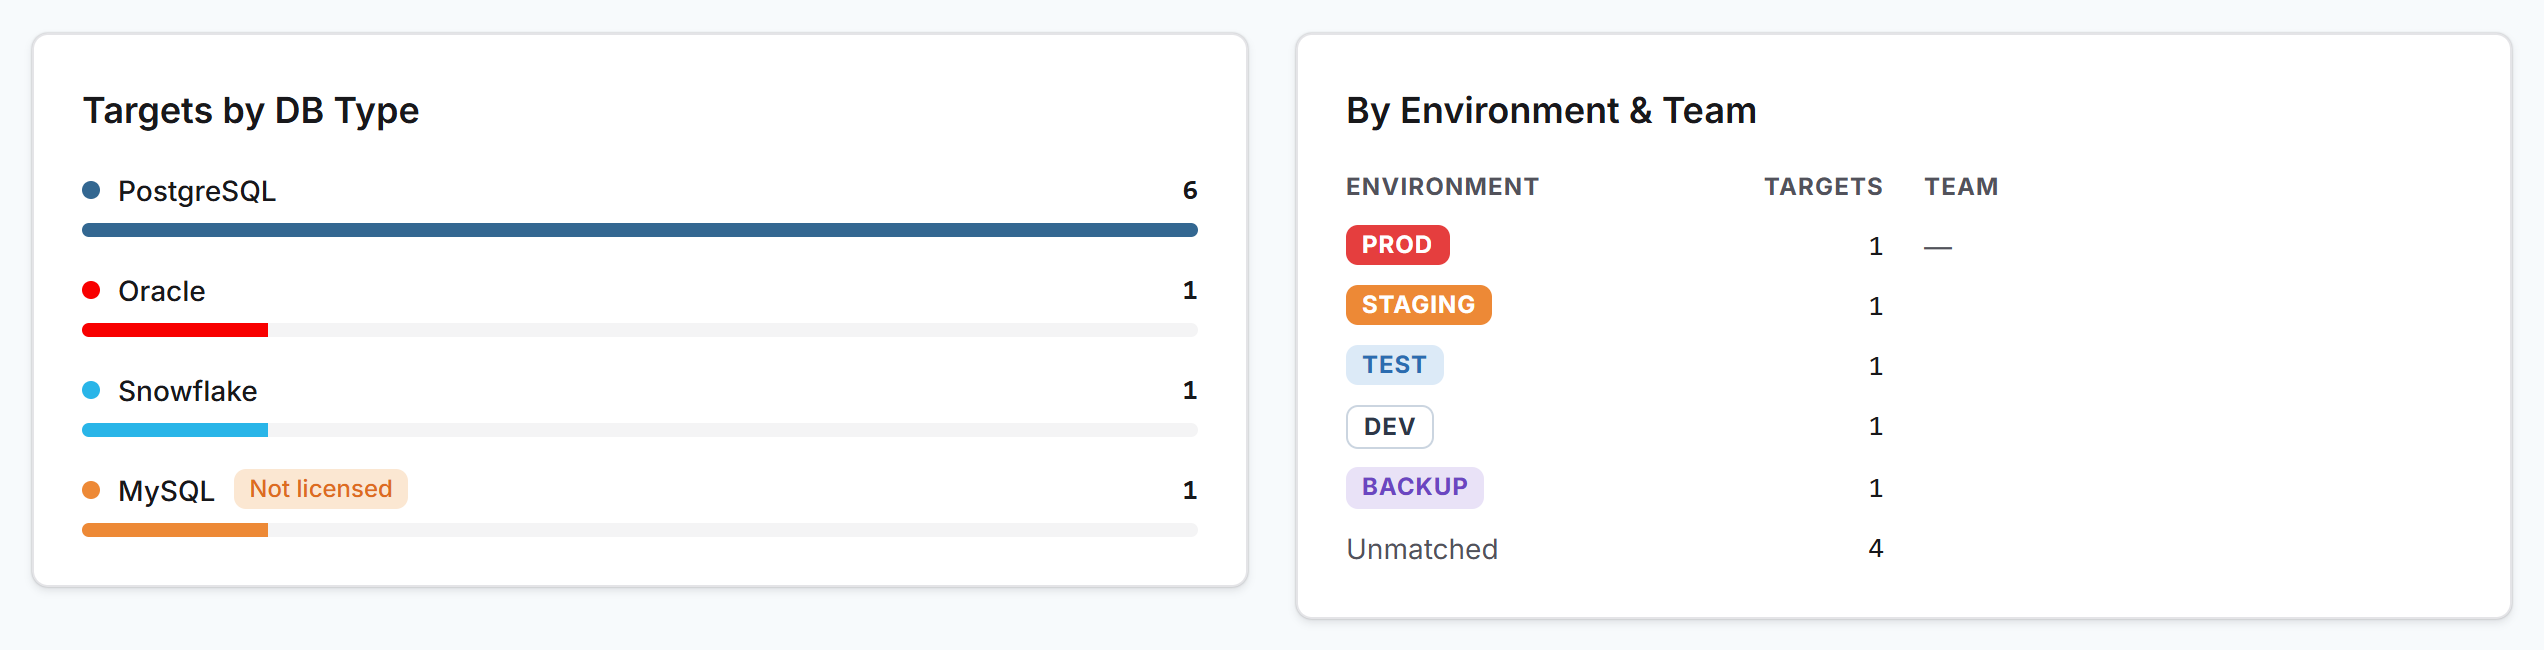
Two cards break the same figure down in different ways:
Targets by DB Type counts targets against the database types your license covers. A type in use that the license does not grant is reported rather than blocked.
By Environment & Team groups targets by the environment of the registered connection each one matched.
Environment comes from your registered connections. A reported target only shows a name and an environment if a Connection matching its host, port, and database exists. Targets that matched no registered connection are counted under Unmatched.
Registering your connections is therefore a setup step with a visible consequence here: unregistered targets still count toward capacity, but they stay unattributed.
Check which nodes reported
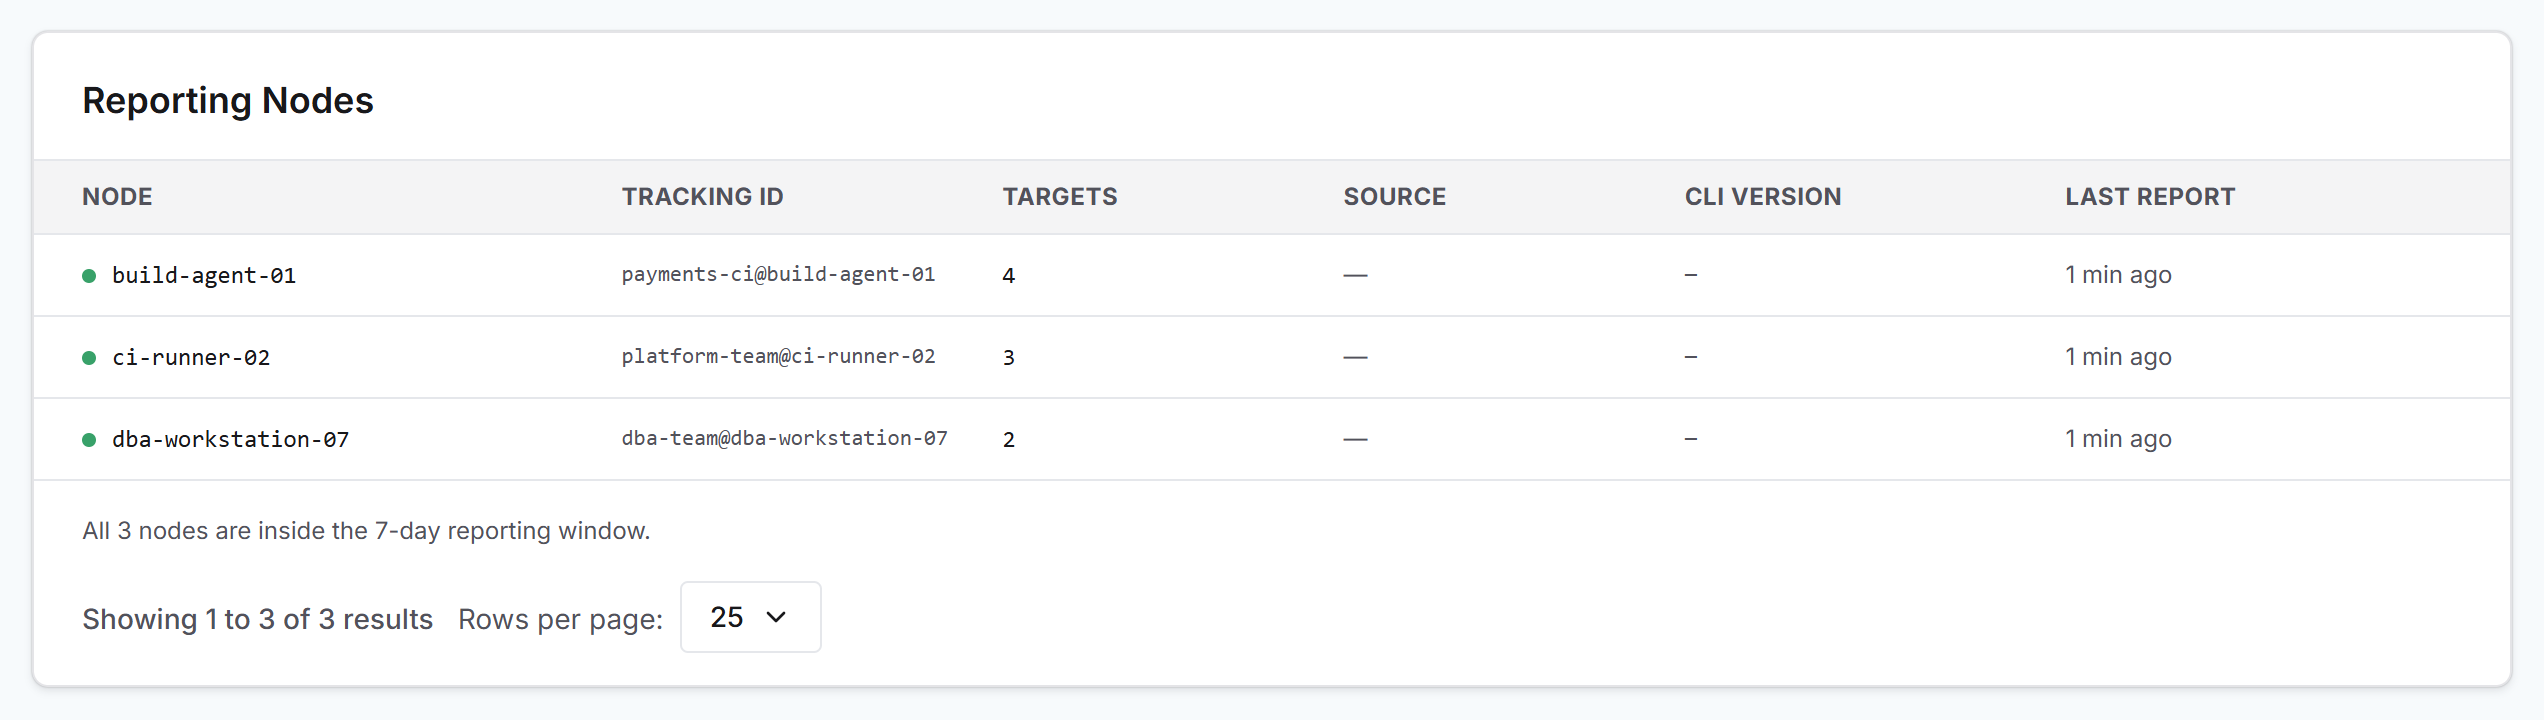
The Reporting Nodes table lists each node that reported, with its tracking ID, the number of targets it accounted for, and when it last reported.
The SOURCE and CLI VERSION columns are present but not yet populated.
Below the table, a line states how many nodes are inside the configured reporting window. A node that has been silent for longer than the stale window is called out, and the days it already reported still count toward the figures above.
The stale window is configurable and defaults to 7 days. See Configure license alerts and thresholds.
Tell an empty window apart from zero usage
The Utilization tab always covers the last 30 days. If no Change Automation node has reported to this installation yet, the tab shows two things instead of the usual figures:
The DB Target Capacity card says no usage was being recorded, so there is no figure to compare.
A card below it reads
This window is not recorded.
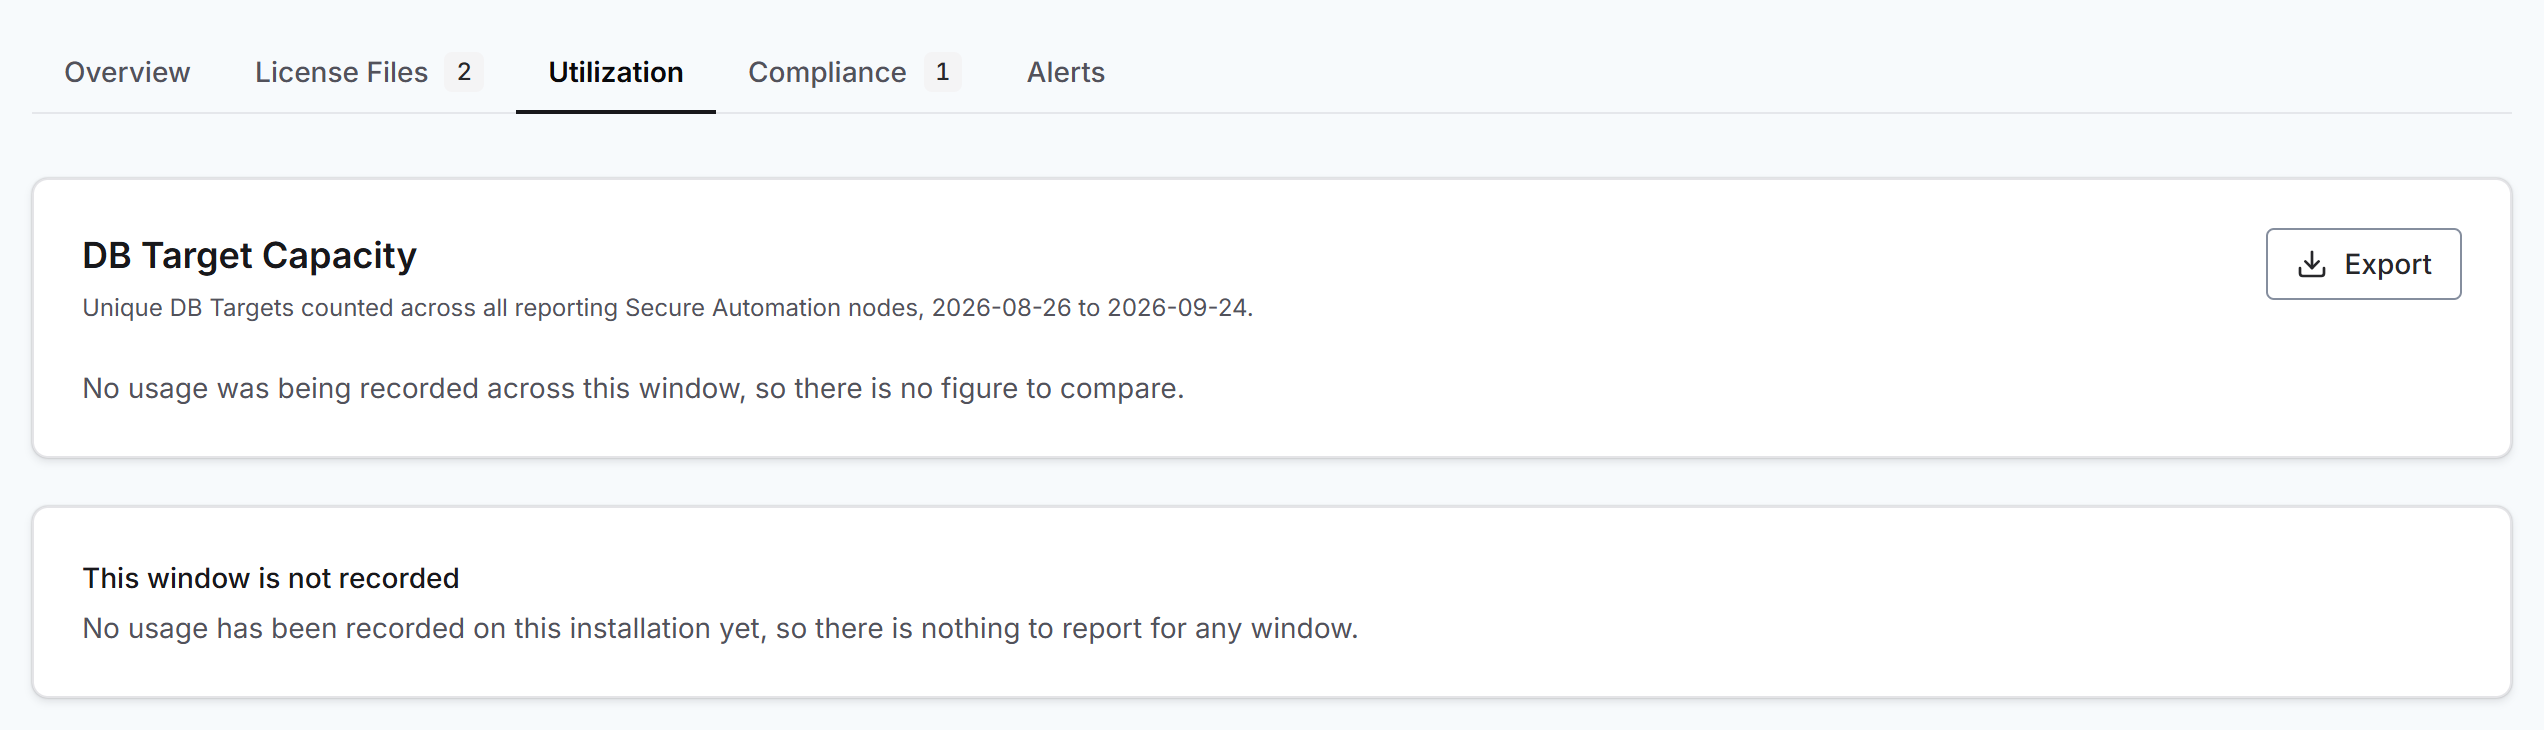
This is not the same as zero usage. Not recorded means nothing reported during the period, so Liquibase has no data about it. Zero would mean nodes reported and nothing ran. The difference matters if you use these figures in an audit. The breakdown cards and the Reporting Nodes table appear once the first node reports.
Export the figures
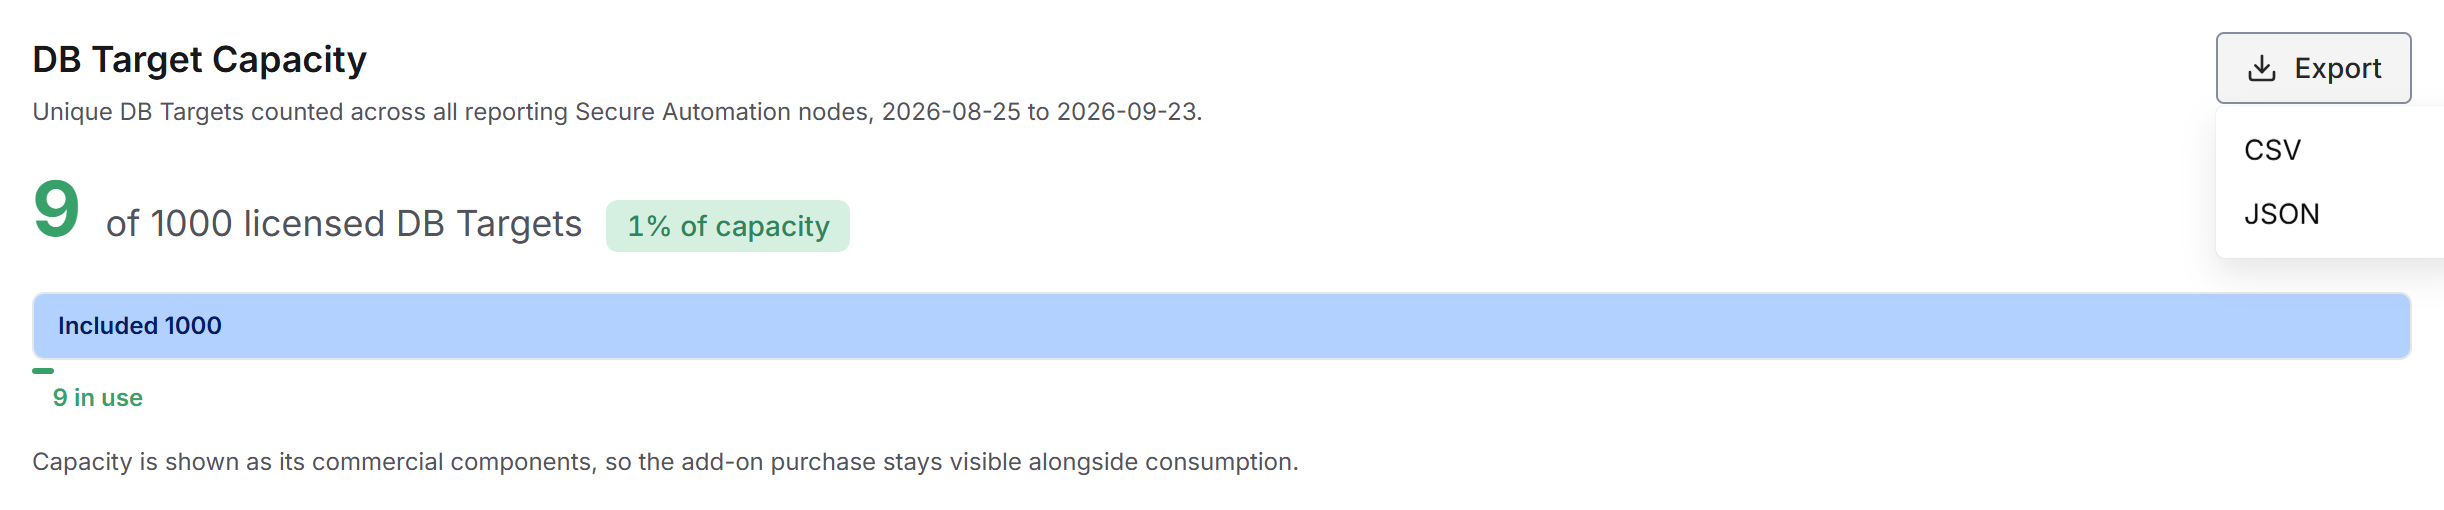
Select Export and choose CSV or JSON. The export covers the same window the screen resolved, so the file and the figures beside the button agree.