- Concept
- Version · 6.0
- Manage
Set up Change Intelligence for your team
Last updated: September 29, 2026
Change Intelligence has three main areas in the left navigation. Monitor is the record of what ran, Measure aggregates those records over time, and Improve is where you work a specific failure or drift finding back to its cause. Everything starts with getting operation records into the server.
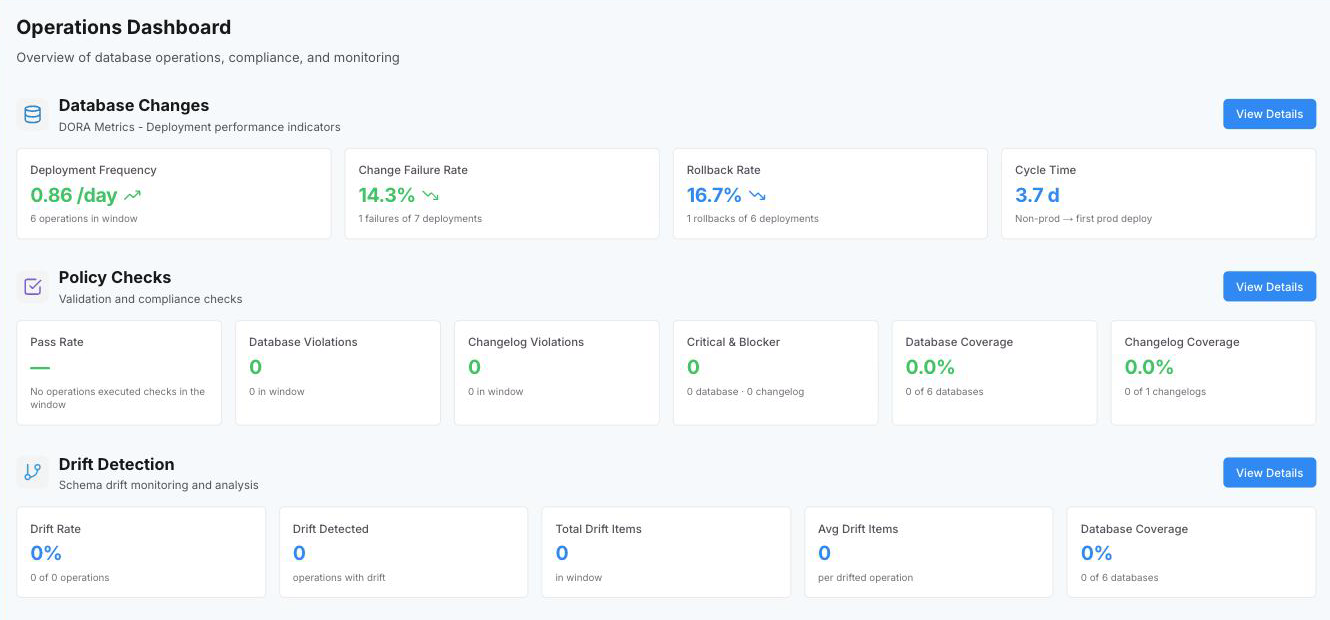
Turning on reporting, running a command, and reading the result follow one data flow, which runs from the Liquibase Secure CLI to Liquibase Secure server and back to your browser:
The Liquibase Secure CLI executes a command on a CI/CD agent or developer workstation.
The Change Intelligence extension, which ships inside the CLI, captures the resulting operation metadata as JSON.
Sensitive properties are stripped at the extension before any network call, so the secret is never materialized on the sending host.
The redacted payload is sent over HTTPS to the project scoped ingest endpoint of Liquibase Secure server, authenticated by a service principal token.
The Change Intelligence module validates and persists the operation, then fans out a real time event to any connected dashboard sessions.
You browse, filter, and optionally request AI analysis of individual operations in the dashboard. Policy check runs arrive through the same path, so policy outcomes appear alongside deployment and drift evidence without a Change Governance assignment.
What you need
Contact us to enable Change Intelligence.
Liquibase Secure server is running and you can log in. If it is not stood up yet, start with what Liquibase Secure server is and the server requirements.
Liquibase Secure 6.0 or later, with a valid Secure license, on the machines that run Liquibase. The reporting extension ships inside the distribution, so there is nothing to download and no install step.
Java 11 or later.
A service principal token. Ingest accepts service principal tokens only. In the dashboard, go to Administer > Service Principals, create a service principal scoped to your project, select Create & generate token, and then Copy token. The token is shown once.
The address of your server with
/apion the end, for examplehttps://liquibase.example.com/api.
Turn on reporting
The extension is disabled until you enable it. Set the values below in liquibase.properties, or as the matching LIQUIBASE_PLATFORM_* environment variables, once per environment in your CI/CD configuration. Each environment points at its own database connection and changelog and does not need to change afterward.
Note: Reporting degrades gracefully. If the server is unreachable your Liquibase commands still succeed, and the operation is not recorded.
Then run a command that reports, such as update, and open All Operations. Connect to Liquibase Server walks the setup step by step, Configure operation reporting covers the remaining settings, Which Liquibase commands report lists the commands that produce a record, and Troubleshoot operation reporting covers what to check when operations stop arriving.
How you start depends on where Liquibase already runs.
Your pipeline already produces everything Change Intelligence records, so this is configuration rather than change.
Create a project for the application, then register a database connection and register a changelog for each environment the pipeline touches.
Create a pipeline that orders those connections the way a change actually travels, from development to production.
Create a service principal scoped to that project, and use its token as the API key in your CI/CD configuration.
Add the reporting properties to each environment's configuration. The connection and changelog identifiers differ per environment. The rest do not.
Note: A service principal sends operation data and does nothing else. It cannot sign in to the dashboard, and a batch naming an entity outside its projects is refused. Ingest accepts service principal tokens only, so issue one per pipeline.
A single local run shows the whole flow.
Create a project, then register a database connection and a changelog for your runs to attach to.
Create a service principal scoped to that project, then put its token and the reporting properties in the
liquibase.propertiesfile beside your changelog.Run
update, or another reporting command, against a sandbox database. Run Liquibase against the H2 sandbox is a ready-made target if you do not have one.
Values in liquibase.properties persist on their own, which makes it the simplest choice locally. Environment variables set in a terminal last only for that session.
Note: A service principal token requires both the connection and changelog identifiers. Set them to a database connection and a changelog registered in the project the service principal is scoped to.
See what you recorded
Operations arrive as they run. Monitor is the entry point for everything Change Intelligence has recorded, and View database deployments is the run-by-run list across every database you report on. Each row carries the command, whether it passed or failed, the database and changelog it ran against, and how long it took.
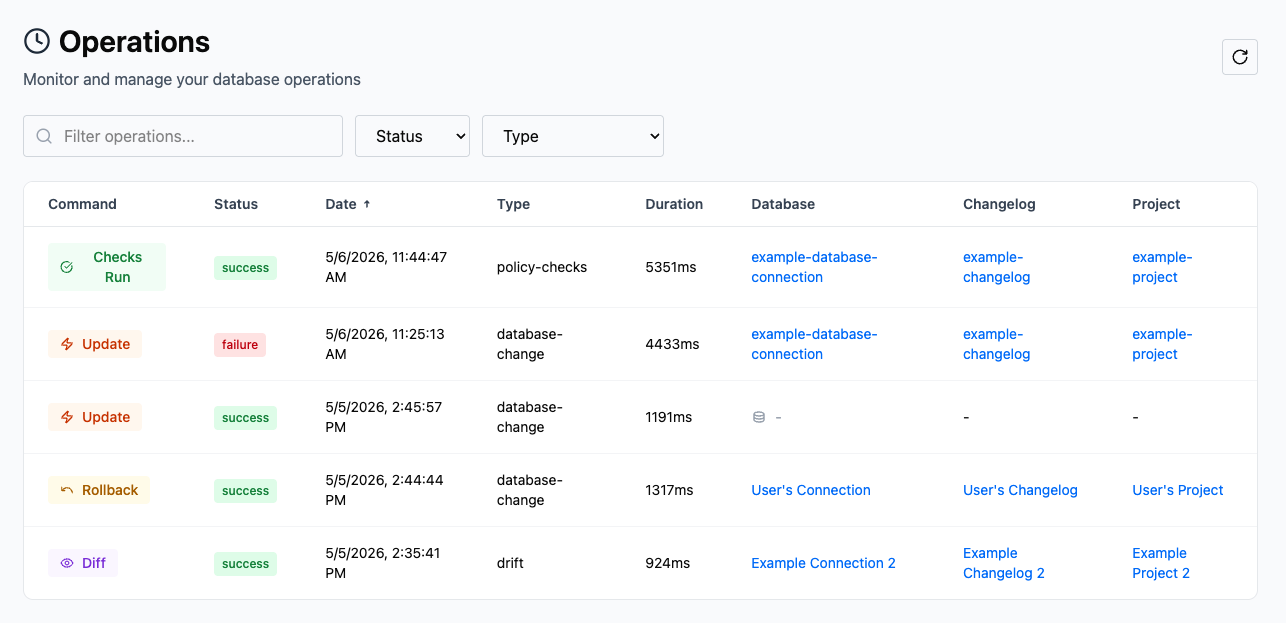
Filter activity by project, pipeline, database, or environment to narrow a wide estate to the part you own, and find successful and failed operations when you are looking for one outcome in particular. What are operations? explains what a record holds and where each field comes from.
Track how changes move from development through test and staging into production, and spot gaps, failed steps, skipped environments, and unexpected divergence in one interface. Review deployment history is the same record read per database rather than per run.
Read a single operation
Review an operation's details to see everything one run recorded: its status and how long it took, the database it ran against, the exact command and the Liquibase version that executed it, the changesets it included, and the execution log captured line by line.
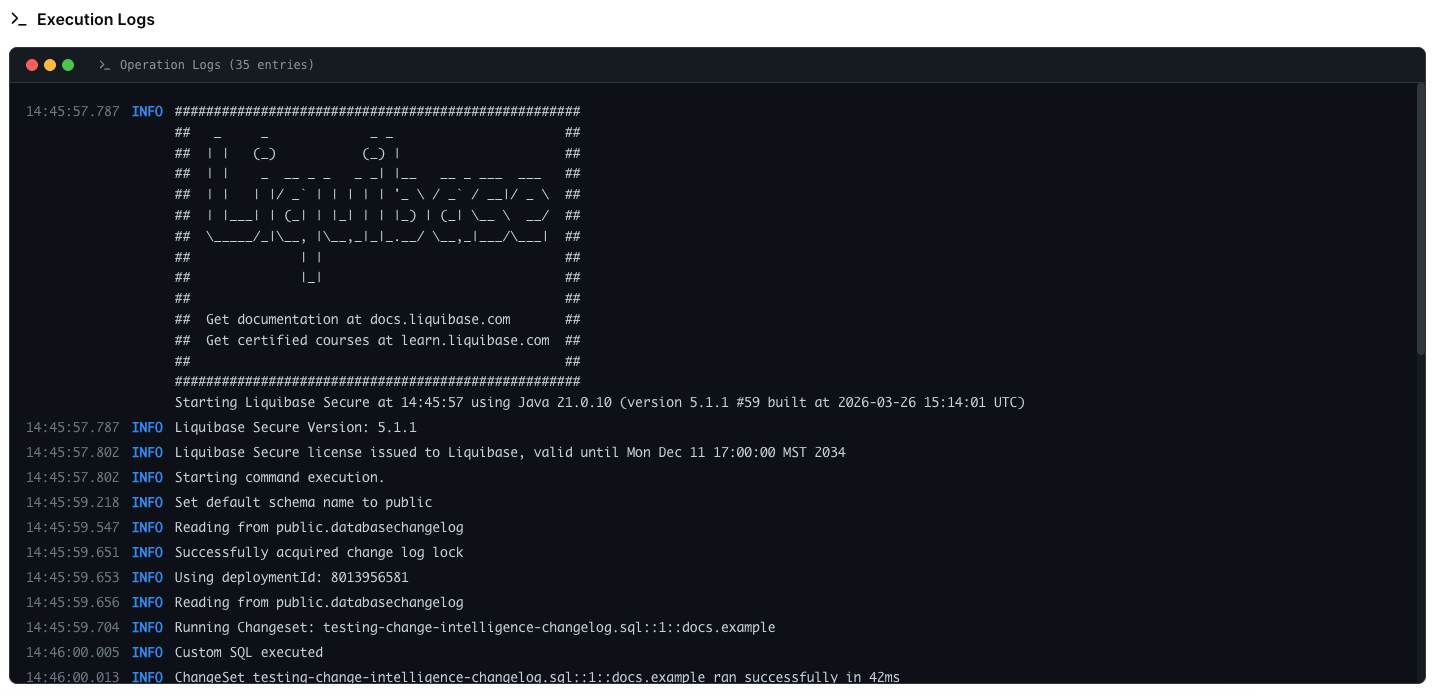
The execution log is what removes the correlation step. Output you would otherwise hunt for in a CI job that has since rotated away sits on the operation itself, next to the changesets that produced it and the environment it ran in.
Watch for drift and policy outcomes
Drift detection compares a database against the state your changelog describes, at the cadence you configure, typically as a scheduled CI/CD job. Identify drift lists the databases that no longer match, understand where drift occurred locates the object and the environment the change landed in, and compare expected and actual database state is the side by side diff, with the execution log that produced the finding beside it. The combination is reviewable evidence for a compliance team and a fast investigation path for an engineering one.
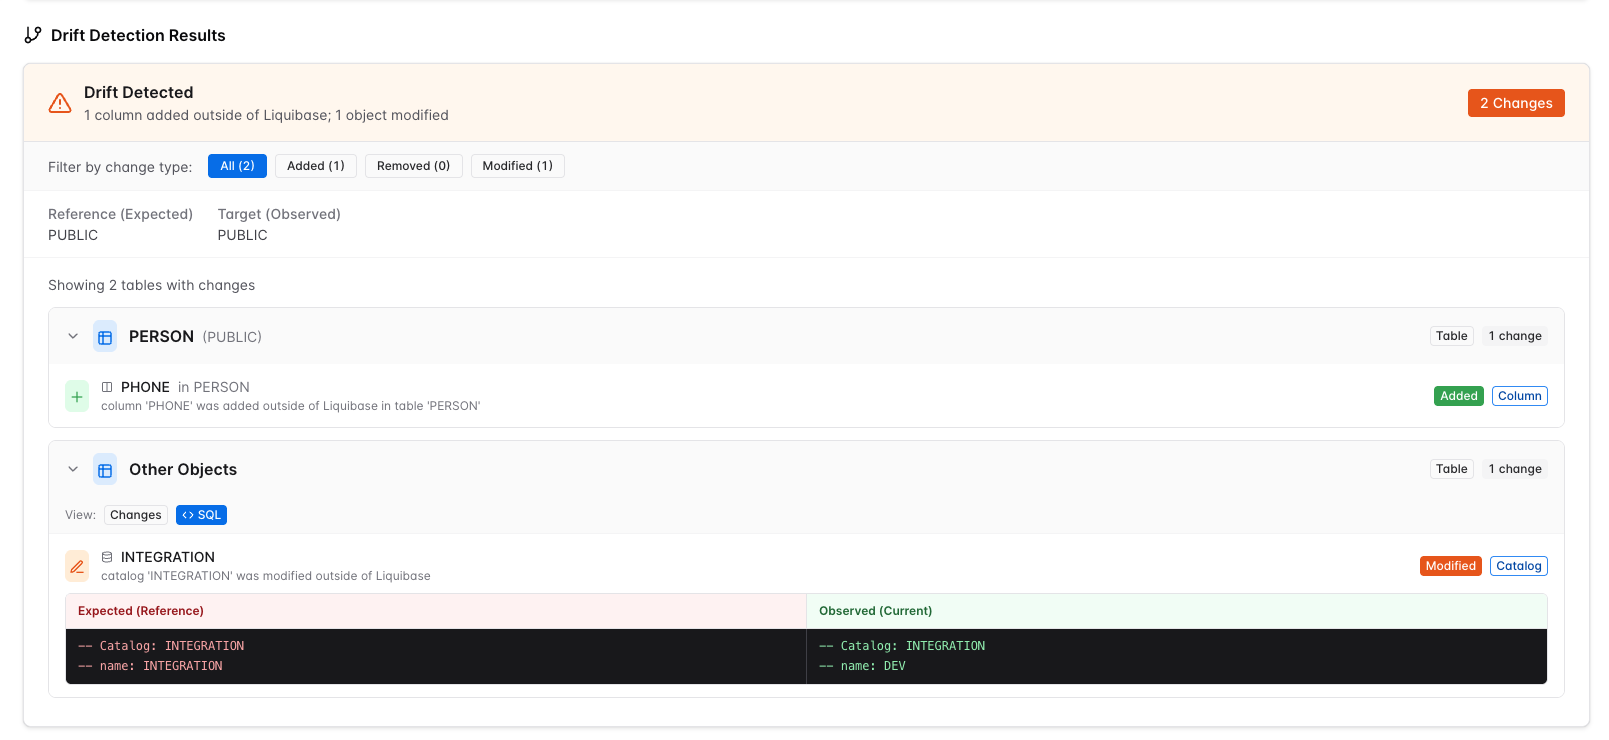
Understand drift history tells you whether a finding is new, recurring, or spreading, and identify databases requiring investigation triages which ones are worth attention first.
Policy check runs land in the same record. What are policy check results? covers where outcomes appear against the operations that produced them, and from there you identify policy violations, understand policy outcomes, view policy execution, and find affected deployments and databases.
Reading the record tells you what happened. What you do next depends on what you found.
Investigate a failed deployment works back from the failure to the changeset that caused it, using the operation's full history, its structured execution log, and the environment context already on the record.
On an operation you have opened, Analyze issues summarizes the failure, identifies likely causes, and proposes remediation steps, if AI analysis is enabled for your workspace. Nothing is sent to a model provider until you ask for it on a specific operation.
Once you know the cause, decide whether to roll back or fix forward weighs what each recovery path costs, and correct and resubmit the change closes it out.
If nobody recognizes the run, investigate an unattributed operation establishes where it came from.
Investigate detected drift establishes what changed outside the pipeline and when, starting from the diff and the execution log on the drift result.
Drift is rarely a single question. Understand drift history shows whether this object has drifted before, and measure drift across your databases shows whether the problem is one database or a practice.
Where the drift turns out to be a change you want to keep, track and append manual changes with snapshots and diff-changelog brings it back under the changelog.
Investigate a policy check failure finds what the failing policy actually blocked, and why, from the checks run recorded against the deployment.
For the developer on the other end, respond to governance failures is the path from a blocked change to a corrected one, and understand policy outcomes covers how severity, exit codes, and status relate.
If the same check keeps firing across teams, that is a governance question rather than a deployment one. Analyze patterns in policy failures over time is where it belongs.
Measure the trend
One operation tells you what happened once. Measure aggregates the same records over time, so the question moves from what broke to whether you are getting better.
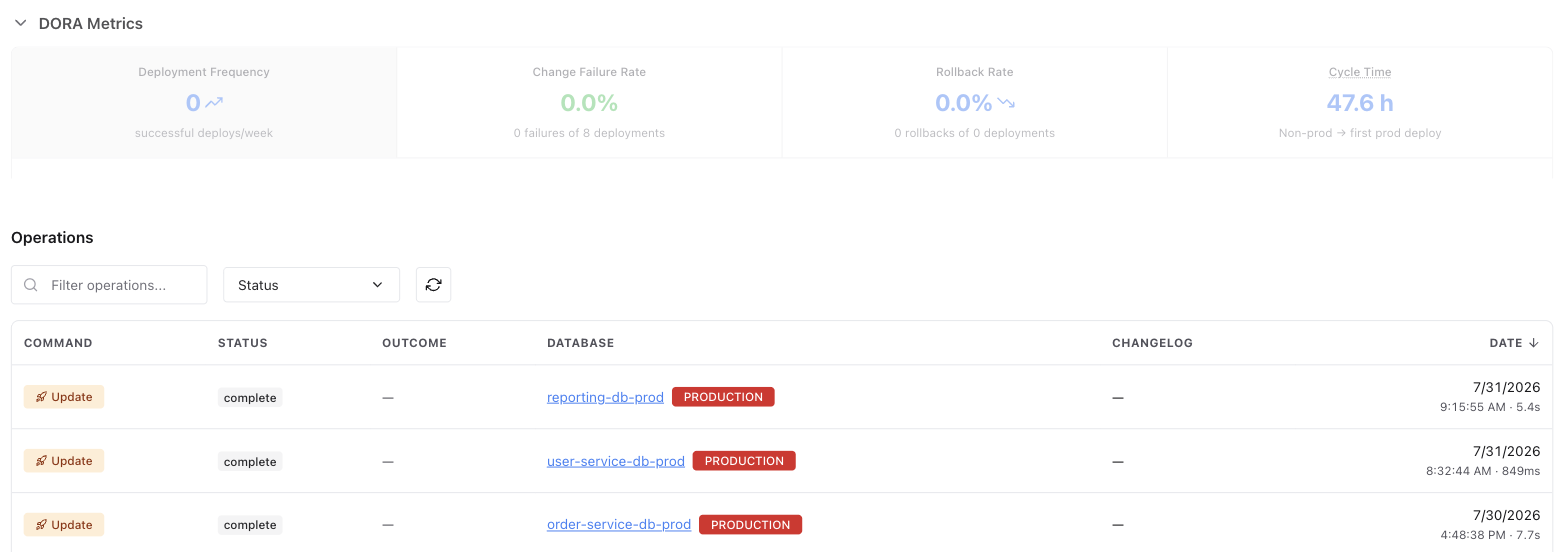
View governance and delivery dashboards puts delivery performance and governance health side by side. Measure deployment performance computes the DORA metrics, deployment frequency, change failure rate, rollback rate, and cycle time, continuously from operation data and grouped alongside the policy and drift signals rather than in a separate tool. Measure governance effectiveness asks whether your policies are catching what they should, and measure drift across your databases asks how widespread drift is and whether it is getting worse.
From there, compare applications, teams, and environments shows where the estate is uneven, identify areas requiring attention points at the constraint, track improvement over time shows whether the fix held, and track KPIs and OKRs maps the indicators you already report on onto the figures the server computes.
Produce audit evidence
Change Intelligence captures an immutable record of permission and configuration changes alongside operation evidence. A security reviewer answers questions like who had access to this project on this date without needing elevated permissions on another system, from the audit log of permission changes.
Become audit ready covers what auditors ask for and where Liquibase already holds it. Document all database changes and produce the database change reports turn the record into the evidence a review asks for. Change authorization best practices shows that changes were approved before they deployed, and access controls and separation of duties shows who could do what, and when.