- Concept
- Version · 6.0
- Monitor
What is drift detection?
Last updated: September 29, 2026
What drift is, how drift checks reach the server, and what the Drift Detection dashboard and details page show.
Schema drift occurs when a database's actual state no longer matches what Liquibase expects based on your changelog. This happens when changes are made to a database directly, outside of Liquibase, such as a column added manually in production or an index dropped during an incident.
The server captures drift detection operations run by the Liquibase extension and surfaces them here. When you run a diff or diff-changelog command, the extension automatically reports the results to the server. No extra steps are required beyond having the extension configured.
Every diff and diff-changelog run appears in the dashboard, whether or not drift was found. The Status field reflects whether the Liquibase command completed successfully, not whether drift was detected — a success status means the command ran without errors, and does not mean the database is in sync. To see whether drift was actually found, check the Drift column: it flags this directly in the list, without needing to open the operation.
When drift detection is useful
There are two common scenarios where drift detection applies. In both cases, you can run either diff or diff-changelog. The commands perform the same comparison. diff outputs a description of what differs between the target and reference; diff-changelog outputs the changesets needed to bring them back in sync. The server captures both the same way.
Comparing a target database against its expected state Use a changelog or snapshot as the reference to see what has changed outside of Liquibase: objects that were added, removed, or modified without going through a changelog.
Comparing a target database against a reference database Use another live database as the reference to verify that two environments, such as staging and production, are in sync.
In both cases, Liquibase can generate the missing changesets from the diff results. Those changesets can then be applied to bring the database back in sync, or marked as already run to align the Liquibase tracking table with the database's actual state.
The Drift Detection dashboard
The Drift Detection dashboard shows all drift check operations captured by the extension across your database connections. You can search for operations using the Filter operations search bar and narrow the list using the Status dropdown filter.
Liquibase Secure 6.0 adds a full filter bar to this view, with saved views and shareable filtered URLs. See Filter activity by project, pipeline, database, or environment for how filtering works.
Five metric tiles at the top of the dashboard summarize drift across your connections. For what each one counts, including which of them deduplicate per database, see Measure drift across your databases.
Operations list
To find databases where drift was detected, scan the Drift column — it flags exactly which operations found drift without needing to open each one. Select any operation to open its detail page, where the Drift Detection Results section lists exactly what changed.
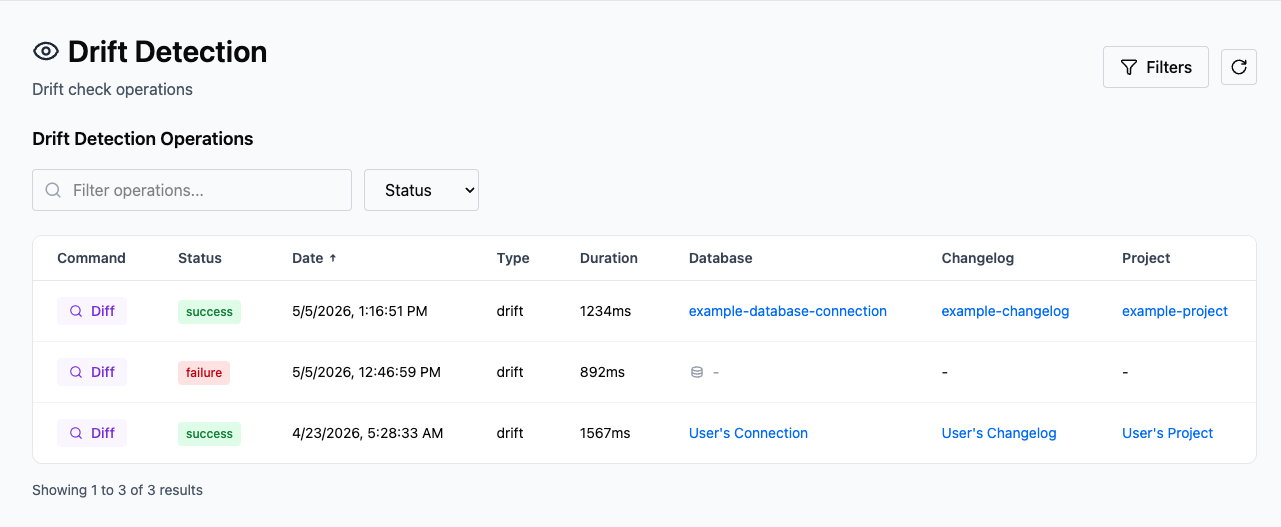
Operation fields
Field | Description |
|---|---|
Command | The Liquibase command that ran, such as |
Status | The result of the operation: |
Drift | Whether this operation detected drift: |
Changes | A breakdown of what the drift check found, as three counts: Added (objects present in the target but not in the reference), Removed (objects present in the reference but missing from the target), and Modified (objects that exist in both but differ). See Drift Detection Results for the full definitions. Counts of zero are shown de-emphasized rather than hidden, so you can still confirm nothing of that type changed. |
Database | The database connection the operation ran against, along with its environment (for example, Production or Staging), when the connection has one assigned. |
Date | The date and time the operation ran, along with how long it took to complete. |
The Drift Detection details page
Selecting a drift check operation from the Drift Detection dashboard opens its detail page. This page shows the full results of a diff or diff-changelog command captured by the Liquibase extension, including which database objects were added, removed, or modified, and the complete execution log from the run.
If you ran your operation with the --reports-enabled flag, an HTML report is also available. Select View Report in the top right corner to open it.

Header
The header identifies the operation: the operation type Drift as the title, a badge naming the command that ran (Diff or Diff Changelog), a status badge (success, warning, or failure), a drift outcome badge, and the operation's short id. The type and the command are separate: a diff and a diff-changelog are both Drift operations, and the badge is what tells them apart. The outcome badge reads Drift when the check found differences and Clean when it did not. View Report sits at the right of the same row.
Directly beneath that, a context line gives the operation's key entities at a glance:
Field | Description |
|---|---|
Database | The database connection the operation ran against. |
Changelog | The changelog associated with the operation. |
Project | The project (or projects) it belongs to. |
Run by | The user who ran the operation, as reported by the Liquibase extension. |
When the database, changelog, or project is registered in the server, its name links to that entity’s page. An unregistered database shows its name as plain text without a link. A drift check that compares two databases directly has no changelog or project to link, so those fields show a dash, as in the example above. On narrow screens the line wraps onto more rows rather than truncating, so no value is hidden.
This header is the same on every operation type. See Header on the Operation Details page for the full description.
Operation summary
The Operation Summary card shows when the drift check ran and how long it took. A success status in the header means the diff command completed without errors. It does not mean the database is in sync. See the Drift Detection results section below for what the check actually found.
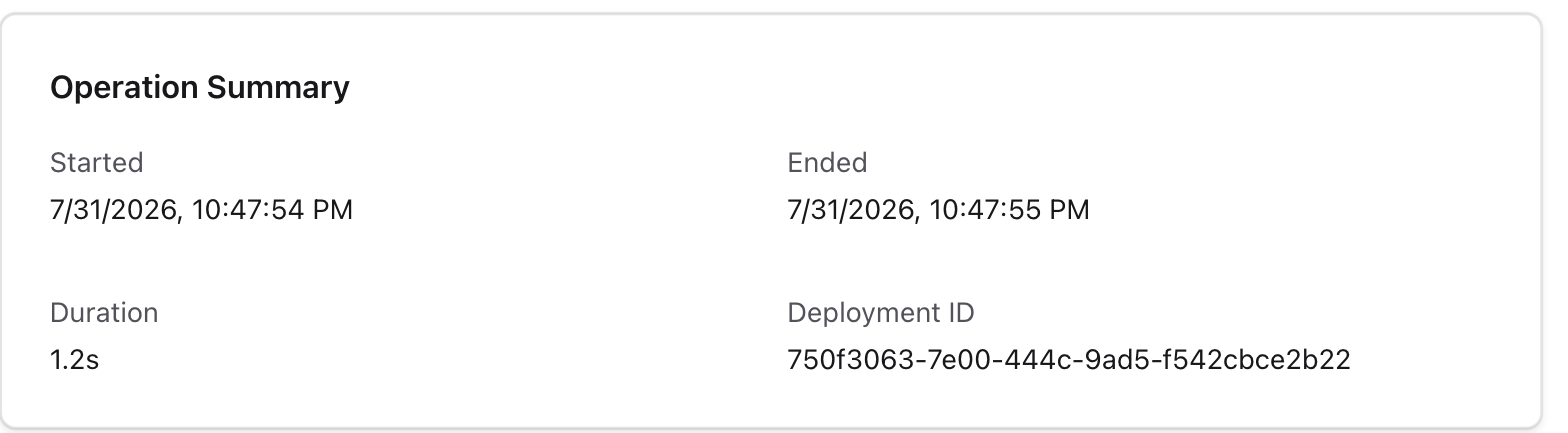
Field | Description |
|---|---|
Started | The date and time the operation started. |
Ended | The date and time the operation completed. |
Duration | How long the operation took to complete. |
Deployment ID | A unique identifier for this operation run. |
Outcome breakdown
The Outcome Breakdown card sits beside Operation summary at the top of the page. It summarizes what happened to the changesets in a deployment, which is an update concept. A drift check deploys nothing, so on this page the card reads No outcome data for this operation. That is expected on a diff run and is not an error. What the check actually found is in Drift Detection results.
AI analysis
The AI Analysis card offers AI-generated explanations of a drift check. It appears when AI Analysis is enabled for your workspace, on every Drift Detection operation, including clean runs where no drift was found.
Two actions are available:
Summarize: always available. Generates a plain-language summary of what the drift check found.
Analyze issues: available when the check detected drift, or when the operation did not finish cleanly. Diagnoses what it found and suggests how to respond. A drift check that finds differences still reports a technical
successstatus, so this button is offered on the strength of the drift itself, not the status.
Generation runs in the background. While an analysis is running, the card shows a status indicator and the result does not open on its own. When it finishes, expand the result to read it. Selecting an action again re-runs it.
Because a summary and an issue analysis can run at the same time, each in-flight run has its own control: Cancel Summary and Cancel Analysis. Cancelling one leaves the other running.
Each analysis is saved with the operation, so a later visit shows the most recent result along with the model used, when it ran, and, where known, who triggered it. When both a summary and an issue analysis exist, both are shown. The Previous Analyses list keeps the full history, grouped as Summary and Issue analysis.
Note: An operation with very large logs can exceed the AI model's context window, and the analysis fails with The operation's logs are too large for the AI model's context window. Try a smaller operation, or increase the model's context length. The logs are not truncated to fit, so either analyze a smaller operation or raise the context length your model is loaded with. This limit is the model's own input capacity, not the cap on how long the generated answer can be.
This card behaves the same on every operation type. See AI analysis on the Operation Details page for the full description.
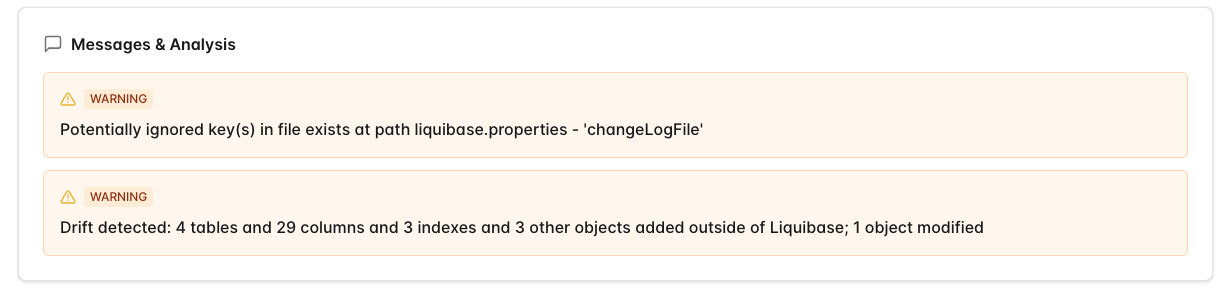
Messages & analysis
Shows warning and error messages surfaced during the operation. This section appears only when the operation produced messages. AI-generated summaries appear in the AI analysis card above, not here.
Target Database and Reference
A drift check always compares two things: the Target Database (what was actually observed) against a Reference (what it was expected to look like). Both are shown as their own collapsible sections.
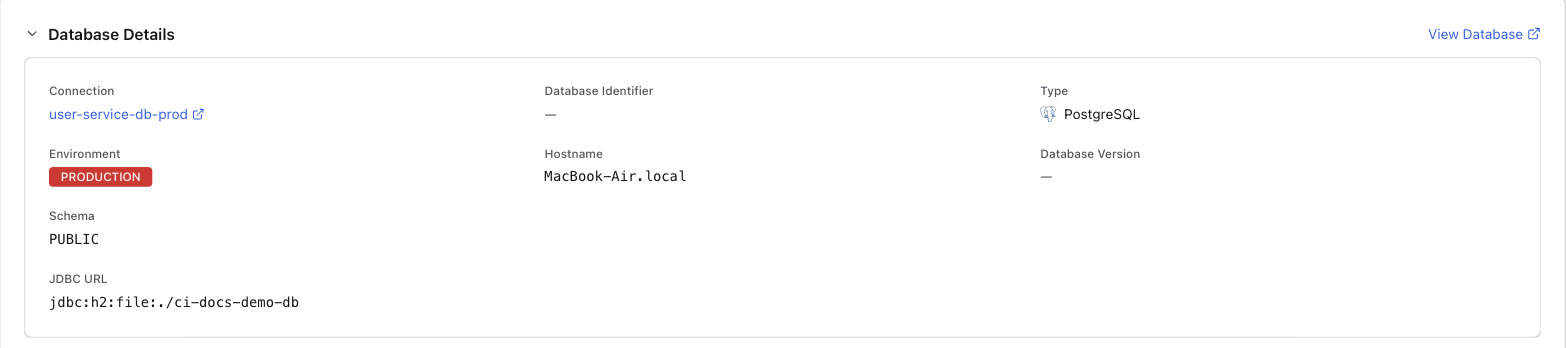
Target Database is the database the operation ran against. It is the one being checked for drift. If it matches a database already registered in the server, its fields link through to that connection; otherwise it's shown as unregistered with an option to register it.
Field | Description |
|---|---|
Connection | The database connection the operation ran against. Select the link to view the connection. |
Database Type | The type of database, such as PostgreSQL. |
Hostname | The hostname of the database server. |
Database URL | The JDBC connection URL used for this operation. |
Reference is what the target was compared against, and takes one of two shapes depending on how the drift check was run:
Reference (Database): for a database-to-database comparison (a
diffcommand), this shows the same fields as Target Database, taken from what the operation reported.Reference (Snapshot): for a database-to-snapshot comparison (a
diff-changelogcommand run against a captured snapshot file), this shows the snapshot's filename, capture time, source database, and schema scope instead, since a snapshot has no hostname or connection URL of its own.
A reference database is currently always shown as unregistered, even when the same database is registered in the server. Unlike the Target Database, a reference is not yet linked to its registered connection, so its fields do not link through. Read the hostname and database URL to identify which database was used as the reference.
Changelog details
A collapsed section describing the changelog associated with the operation. Expand it to see:
Field | Description |
|---|---|
Changelog | The changelog name. When the changelog is registered in the server, the name links to its page. |
Format | The changelog format, such as XML, SQL, YAML, or JSON. |
Changesets | The number of changesets in the changelog. |
Project | The project (or projects) the changelog belongs to, each linking to its page. |
Last Updated | When the changelog's registered details were last modified in the server. |
Path | The changelog file path, when recorded. |
A diff run that compares two databases directly does not reference a changelog. In that case the section still appears, with a short note that no changelog was recorded.
This section behaves the same on every operation type. See Changelog details on the Operation Details page for the full description, including where each field comes from.
Properties
A collapsed Runtime Summary section listing the configuration that was actually in effect for the drift check. These are the effective values, not the literal command line. Sensitive values such as passwords and tokens are stripped at the Liquibase extension before anything is sent, so the server never receives or stores them.
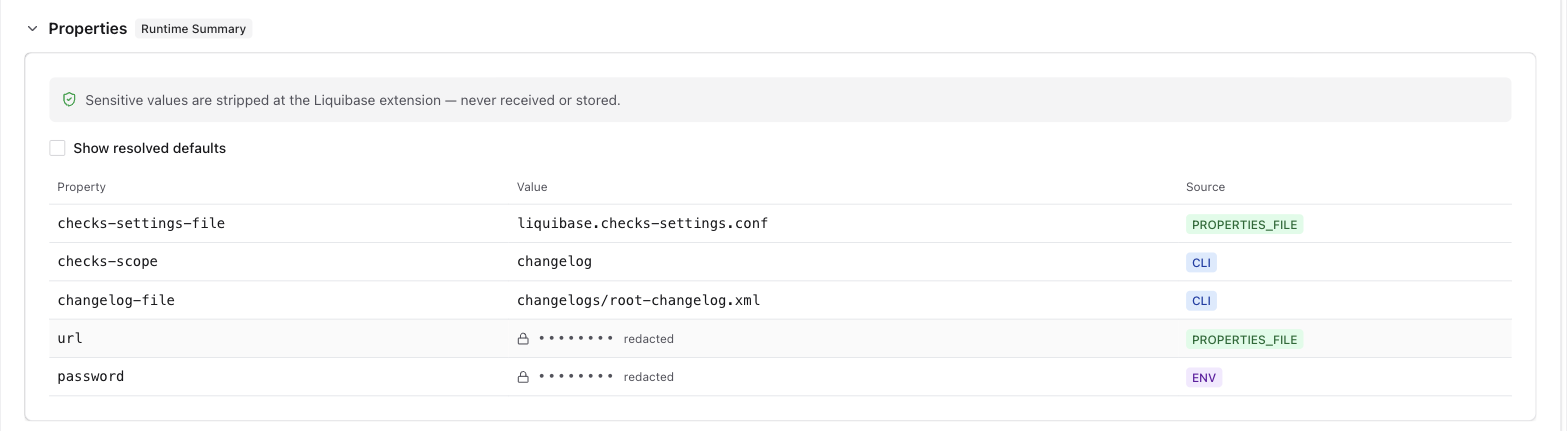
This section behaves the same on every operation type. See Properties on the Operation Details page for the full description.
The literal command line is not shown. If you ran the operation with --reports-enabled, the full Liquibase HTML report is still available from View Report in the page header.
Drift Detection results
Shows a breakdown of all schema changes detected between the reference (expected) schema and the target (observed) database, organized into tabs:
Tab | Description |
|---|---|
All | Every detected change. |
Added | Objects present in the target that are not in the reference, added outside of Liquibase. |
Removed | Objects present in the reference that are missing from the target. |
Modified | Objects that exist in both but differ between the reference and target. |
Each tab shows a count of how many changes fall into that category, and selecting a tab filters the list to just that change type. Tabs with no results stay visible but are dimmed, and when the run detected drift the All tab is marked so you can see at a glance that there is something to review. Long lists are paginated, ten objects to a page by default.
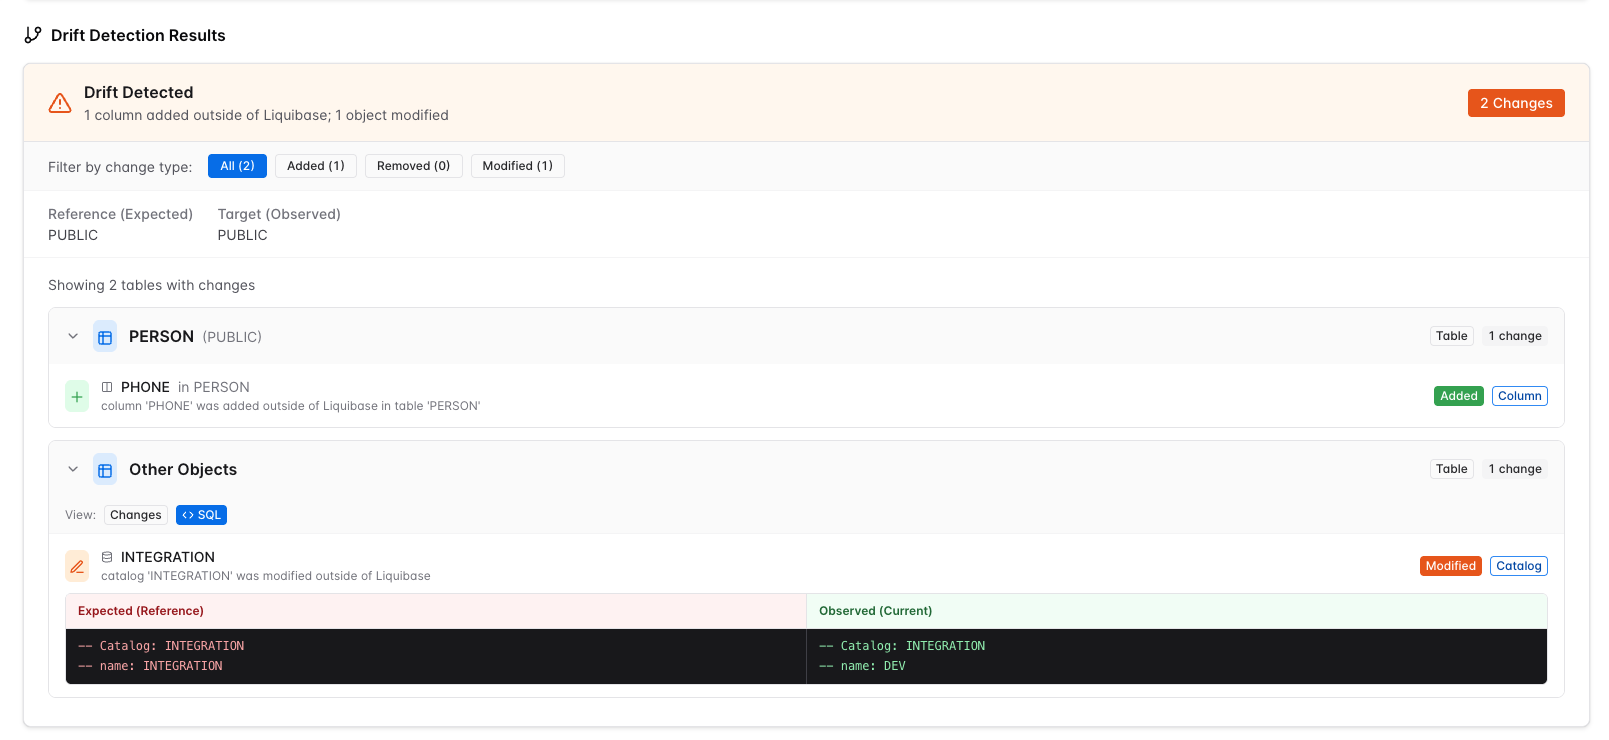
In this example, two changes were detected. The PHONE column in the PERSON table is marked Added because it was added directly to the target database outside of Liquibase and does not exist in the reference schema. The INTEGRATION catalog entry is marked Modified because the catalog name differs between the two databases: the reference database is named INTEGRATION while the target is named DEV.
Each entry shows the object’s fully qualified name, its object type (table, column, index, primary key, and so on), a badge for the change type, and its Drift Age, for example first detected 5d ago. The age is shown as a single largest unit, so a change found minutes ago reads first detected 12 min ago and one found last week reads first detected 7d ago. Drift Age is calculated from the earliest prior drift check on the same database connection where this same object showed the same change. It is measured to the moment you open the page, so it keeps counting up the longer a change goes unaddressed, even if you view the operation well after it originally ran.
Select an entry to expand it and see the object’s full definition rendered as a source-control diff:
Added objects show their complete new definition as added lines, in green with a
+prefix.Removed objects show their complete previous definition as removed lines, in red with a
−prefix.Modified objects show one inline diff: removed lines for the prior version, added lines for the new one, and unchanged lines as neutral context.
If the operation did not report enough detail to reconstruct a definition, the expanded entry reads No definition data available for this object.
Execution logs
Shows the full execution logs captured during the operation, providing a complete audit trail of everything that occurred during the diff run.